Report on Planner Data in Power BI

Вставка
- Опубліковано 17 гру 2023
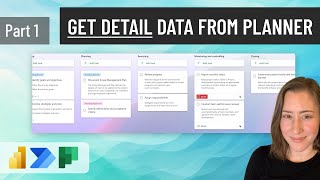
- This video is about how to connect to and model your Microsoft Planner data in Power BI. We’ll go through how to split our Assignees, subtasks, and color flags into dimensions for filtering, then display our subtasks in a table visual with icons to indicate the status. This data source is something we can schedule refresh on, as well as query with Power Automate for more automation fun!
The file demoed in this tutorial is available in GitHub here:
github.com/chpayton/BI-Files/...
The tutorial for how to automate the export of Planner data with Power Automate is here:
• Get Planner Task Detai...
You can schedule refresh on the dataset for this with the technique here:
• How to Schedule REFRES...
Or get Planner data for ALL your groups and plans here:
• Get Planner Data for A...
Send Teams or Outlook notifications asking assignees to update specific tasks from Power BI:
• Use the Power Automate...
Or opt to send all tasks for a given assignee in a single email/chat:
• Send STYLED Lists or T...
I got the unicode IDs for the subtask icons here... the reason I use this one is because it has a “search” feature (the ads there are annoying sorry!):
xahlee.info/comp/unicode_index...
Here's how to put task data in the Microsoft Gantt chart visual:
• How to create a Gantt ...
If you're looking for a reference to recreate the color labels in Power BI, I have the color codes for each here: christine-payton.com/microsof...
1:14 Get your JSON file/path
2:29 Connect to the file & set the path to SharePoint
3:36 Transform the data in Power Query
10:24 Model the data
11:51 Create calculated columns for Assignees, Flags, Subtasks
18:06 Visualize the tasks
20:11 Next steps - Наука та технологія


This series of videos is a game changer. I'm going to get my inner nerd on and set up the reporting for all our planner projects. My mind is spinning with the possibilities. Thank you.
Watched 4 of your videos from creating the .json file from Power Automate all the way through scheduling the refresh of the power BI sources. This is exactly what I needed. Videos were well done for a rookie like me to understand.
I have 2 questions: 1.) Have you seen where the taskStart and the taskComplete gives a DataFormat.Error that it can't parse the input as a Date value? The taskDue works perfect. one error details is format such as 2024-03-28T10:00:00Z and another would be 2024-03-28T10:00:00.0631607Z 2.) Do you know if adding tasks from a planner tab in a Teams channel would create this Date/Time differently than adding the task from the web planner?
I figured out a way around it. I changed the format of those 2 columns back to text and split the columns by a delimiter of the letter T. I then changed the 1st column of each back to date format and used it.
@@noreason1613 Is this the error you were getting?
Expression.Error: We cannot apply operator < to types Date and Text.
Details:
Operator=<
Left=7 Apr 2024
Right=2024-04-11T10:00:00Z
I tried what you did and no luck :/
Awesome video and just what I needed! I figured out how to get the subtasks to sort properly. For some reason, PowerQuery will sort by orderHint correctly but ConcatenateX() does not. My solution is to sort the subtask table in PQ first by taskId ASC and then by orderHint DESC. Then add an Index column named SortBy after which you can delete the orderHint column. Now you can use SortBy ASC in CalculateX().
Ooo interesting, nice find!
Thank you so much.
You helped me a lot.
Your videos are so helpful! I am a project manager that needs to monitor all tasks not assigned to me among a lot of plans, so this has been life changing. The only issue is that my flow runs FOREVER because I have so many plans/groups (like 60+). Do you have any tips for improving this? Thanks!
your video is really detailed and helpful thank you so much for that. But is there a way we can also get the Priority filed of a task in our power bi
Yes, I go through that in the Part 3 video - it should be linked in the description of this one :)
Amazing tutorial. The best I've seen. After teaching how to obtain data in JSON from Planner in another video, she showed us a step-by-step guide on how to list this data in PowerBI, in addition to giving several tips during construction. Could you tell me how long you have been studying PowerBI?
Aw thank you 😊 I have been learning it since it came out, whenever that was (7-8 years?). It has has only been “officially” my job for the last few years though.
Amazing video easy to understand,
I have a doubt at 4:41 when you convert into a date type I'm getting errors for the values which are showing like 2024-01-22T10:00:00Z
Yes, you need to convert to "date time timezone" first, then convert to date, and select the option to NOT replace the existing conversion step. You can't go directly to date. :)
Amazing video, it was a big help! If you then want to add a slider to filter by the colored labels of the teams task, how can this be done so that the filter list is each individual flag and they could still filter by looking at the concatenated flag column?
Thanks! You would use a similar method to what we did with the assignees - so duplicate the base query (you can remove all the calculated columns since you don't need them there), remove all columns except your flag columns and taskId, then select taskId and "unpivot other columns". That will put your flags all in a single column. Then you relate that table to your Tasks table on the taskId field. You might need to set the filter direction to be "both" if it wants to the arrow to be towards the flag table. Then use the flag column from that new table for your slicer. Then make a column on tasks that concatenates the values in the same way we do for assignees and put that in the table. Basically, you need both the dimension and the concatenation to slice on the single values and display them together.
Hi! Great tutorial! Thanks for taking the time and sharing. I have a question about completed tasks. When I generated the json file it pulled a couple of tasks that were already completed. In the column named taskcomplete those tasks are displaying error. Any way to fix this? Thanks
If you select the white space in the error cell, it should show you the error. It depends what the message is, but the most common will be type errors, where perhaps the value is something that the type conversion doesn’t expect? Depending on what the issue is you can adjust the change-type step to fix, if it’s that.
I have many years of data within our buckets -- one of them is a "Completed" bucket. It takes a long time (6 hours +) to complete the flow. How can I exclude certain buckets from this flow?
There’s not a filter on the list tasks action for what you get, but you could try putting a if-condition inside the “for each task” loop that checks if the % complete =100 and only get the details on the “yes” branch. That will speed things up, but the for each loops are usually pretty slow either way.
For larger projects, you might consider the Planner Plan 1 / Project for the Web, since the data for those is in accessible tables in Dataverse, so no need to use Power Automate.
Your tutorial is very helpful and everything works perfectly - thank you very much!
Do you know if it is possible to get the comments on the bottom of a task card?
Thank! Comments are not currently possible-
Two questions. First, when I try to hit the double arrows on the Buckets column, I only have options to extract to new rows and extract based on a delimiter. The assignees appears to the be the same. So I’m not able to separate the bucket/assignee and name. Second, is it possible to have the assignee avatar show up instead of the name to save space in a dashboard? Thanks so much!
This is normal. I am pretty sure this was covered in the video - buckets you expand to rows, since there is only one bucket per row it's fine to do in the tasks table. Assignees and subtasks you duplicate the query, remove all but taskid and assignees (or subtasks), expand to new rows, then create a relationship between the tables on task id and set to bidirectional. This is a normal thing to do for multivalue fields in data modeling; some people will add bridge tables etc but I am trying to keep it approachable here.
Hi Christine! I'm trying to use this with a planner where I have A LOT of tasks, and it seems like this flow will export 400 tasks, max. Is there a way to get around this that you know of?
Yeah, if you enable pagination on the "list tasks" step, it will page through until it gets them all up to some much larger number. I would also set the concurrency on the loops to 1 to prevent throttling from number of API calls, too.
This and related videos were so helpful! I know very little about building flows and creating PowerBi, and I was able to follow your instructions with ease. Keep doing what you're doing!
I do have a quick question. Re: your DIY where you put your subtasks into a column and list them in the same line as the task, I would like to do the same with Tasks and Buckets. I was able to create a calculated column for this and the checkbox and checkmarks show in the report, but I can't get the tasks to show in one line for the related Bucket. My relationship b/t the Bucket and Tasks table are ok, and I think I created the table correctly in PQ. Do you know if this is possible? Right now, the Bucket title is repeated on multiple lines for each task. Thanks!
Yeah, so if you have a Bucket dimension with one row per bucket, the calc column should be on that Bucket table. You put the bucket name *outside* the concatenatex to avoid it getting into the iteration loop. Here's a formula (I'm concatting with hyphen and comma just as a quick example):
Tasks = Buckets[bucketName] & " - " & CALCULATE(CONCATENATEX(Tasks, Tasks[taskName], ", ", Tasks[taskDue], ASC))
BUT that said, you could also just drop the bucket name into rows on a matrix and put tasks under it for the same effect - it'd group by bucket with task names. Not sure exactly what end result you're going for though :)
@@bi-ome Thank you! :)
I was wondering how the one to many cardinality is possible using the taskID that was duplicated for the different tables. I tried this and got the error that the one to many cardinality is not Valid here.
It should be 1:many tasks to subtasks and tasks to assignments. Sometimes it’ll default to the wrong thing depending on how many rows are in your tables. If you have more than one subtask and more than one assignee on a task, it should let you do it - you could add some subtasks/extra assignees temporarily to set up the relationships if it gives you trouble.
Hello! I am but a lowly intern at a company, but have been tasked with importing Planner data into Power BI and making some reports. My company uses the flags to determine department (IT, HR, Accounting). Is there a way to have a pie chart that displays all the tasks by department, without singling out tasks that involve multiple departments at the same time (IT and HR)? I hope that makes sense.
Yeah, what you will want to do is essentially the same thing we did with assignees, where you put just the task ID and the flags as a separate query (for assignees, it was the assignees column - swapping for flags here), then unpivot the flag columns - select the taskId, right click it, unpivot other columns. That will put all the flags in one column as single values, and there will be multiple rows for those with multiple values. Then make a relationship between tasks and flags on taskId and make it bidirectional, and use that flags column in your pie chart (counting the task Ids as the measure).
Do you have a video or instructions on how to easily create a gantt or timeline view of planner data in power bi?
This is the simplest Gantt to set up. I don’t use Planner data because I hadn’t done the Planner series yet when I recorded it, but it’ll work with any data that has a start and end date column:
ua-cam.com/video/fgCWlXLu-c4/v-deo.html
Thank you so much for doing this! Any reason you can think of as to why my flow is not updating assignees for new tasks? Everything else updates, but assignee is blank.
It should overwrite the entire JSON file each time it runs, so there should be no difference between new vs old tasks, it's getting all of them each time it runs. If you check the outputs in the flow run steps, it can be easier to see what's going on - the return for the "get user profiles" should have content in it, you can then check to make sure that content is reflected in the step that puts it into the array variable, and continue down the chain where it's referenced to see where it's dropping off.
@@bi-ome Again, thank you so much for your contributions. The JSON file is being updated, but for some reason it will only a few characteristics of the task, not the flags, or assignee names. I'm going back to video #1 and I'm going to try again :) Thank you!
@@angrygunny4121 Sure, usually if the structure is off you either have a typo in one of the arrays or missed a step :)
Really awesome tutorial here. Thank you! Is there a way to pull in a link to the the Planner Board and Task for each task so someone using the Power BI report can click and go edit the task/subtask? I realize this is a bit silly/redundant but I expect this will be a useful feature.
Yes, I think that is covered in one of the videos - at least for the tasks - I can’t recall if it was this one, will try to find it 🤣. You can use the same technique for the plans though. We use the plan and task ID columns to concatenate a link to the task in Power Query; you can use that with conditional formatting settings in the table to make the task names clickable.
Okay so I might be losing my mind, I swear I recorded this but can’t seem to find it in any of the videos - all you do is open one of the tasks in Planner and copy the URL, remove the plan and task IDs from the URL and insert the fields in their place in PQ. Double quotes around the strings, & symbol between that and the column inserts to concatenate. If you put it in a matrix you have to use the url icon feature, table will let you make the task names clickable instead.
Is there a way to make sure subtasks is ordered the same way as it did on Planner?
I couldn't find a way to do this with the data fields available other than numbering them and sorting alphabetically. The "new" premium Planner, aka Project for the Web, stores the data in Dataverse and there is an actual column to sort by there, but the non-premium Planner does not seem to have that field available in the Power Automate outputs.
Thanks!
Aw ty!
Thankyou so much for posting these videos. Helping me so much. I have been able to troubleshoot my errors by rewatching and trying again. My last issue I cannot resolve. When I expand the buckets column I have to expand twice (once for Lists once for records), then select only BucketName but it then creates a new task record for each taskID for each bucket Name not just the bucket the task is associated with. What might I be doing wrong?
Did you forget to filter your bucket array in the flow? It’s one of the earlier steps, we use list buckets to get the bucket names and then filter it to one bucket per task before it goes into the variable with all the rest of the data in it.
@@bi-ome Thanks for the quick reply. I had done the filter of the bucket but you prompted did give me place to start rechecking that and everything else buckets. My error was picking up the bucket variable in the Append data to PlannerData rather than picking up the filter output. All working now :). You rock.
When I go to expand buckets, i can't find just name and id, I have alot of columns such as createdBy and PlanID. How do I fix this?
It sounds like perhaps you inserted the incorrect thing in the bucket array variable in the flow? I would check there first-
Hello again :) I've added new flags to my plan, and added them to the code, but they don't pull through. If I create a new Power BI report from scratch and link to the same json file, they show. Is there a way to get them to show in my original report without having to rebuild?
You need to edit the query to get them to show up. Make sure to refresh the query first, because it caches, then go to the "remove other columns" step gear icon and select them so that they don't get removed. If you don't see them there you may need to edit the navigate step to make sure they're getting expanded from the JSON - you can copy the existing format for the flags you have and replace the names in the code. Anything that references the flag columns by name would have to be updated - that's why I say they're a pain. You can get them but it's very fiddly :)
@@bi-ome Got it! They didn't appear in the remove other columns gear, but I edited the expand columns step to include them, then the appeared in the remove other columns. Thanks for the help, it's so appreciated!!
Hey there @bi-ome I've made it basically to the end of your tutorial...but when I go to work on the Due Date, or any date within the visual side of things...it keeps presenting me a Date Hierarchy ,showing Year, Quarter, Month, and Day. How on earth do I just get it to show my short date? Checking my data, as well as the formatting I've set in the model view, I can tell my formatting is correct...just not sure why it's doing this.
😂 This is a setting you can disable in the report settings in the File menu. Everyone turns it off because like you say it’s pretty aggravating - I forget to mention it because I turned it off permanently and forget it exists haha!
@@bi-ome Okay, so the only other question I have is...what if you want to add a column that you had previously removed from the report? For example, if there's a lastModified date you wanted to pull in, how would you go about re-adding it if you'd removed it previously. Unsure if that's even an option here, but looking to do that on my report.
@@brandontheITguy As long as it’s still in the JSON data, if you go back into your query editor (transform button), you can edit the steps there and apply. So if you did a “remove other columns” step there’s a gear icon next to it that you can adjust the columns removed, or if it’s a “remove columns” you can delete or edit the step.
Once again...great video. When I go to model view, I have no relationships that exist. If I go to manage relationships and new , i then highlight the taskID in both the subtasks and tasks. I select under cardinality one to many and for the cross filter direction both and check the box for make this relationship active. I get a yellow error that says the cardinality you selected isn't valid for this relationship
Thanks! 😊 For the date, you convert to date time timezone first, then to date, and tell it to not replace the step when it asks. It won’t go directly from the original format to date.
I get the message that the columns doesn't have unique values. The selected column can't be the key column because it contains duplicate values. Choose a column that has unique values in every field
@@msladykswiss Yeah, your tasks table should have unique values for task ID unless you've expanded rows in it. I would check in the query editor to see what is causing the duplicates and fix that first--
Would it be possible to have a tutorial on visualizing this data.
Yeah, it's on the the top of my list - I've been hesitating on it while waiting to see what the deal with the "new" Planner was, but it's looking like DIY will still be a valid way to go as far as I can tell, so I'll see what I can do. :)
how to use alternate query in Power query mode instead of Table. I'm using data by appending hence i will not get value if i change in Table by adding formula.
Not sure what you’re asking, in the prior videos we appended data to an array and created a json file. We can expand the json like a table with Power BI - that’s what we do here
@@bi-ome
I'm using SharePoint with People column having multiple values.
So I need to expand in one row data by using power query
SharePoint works very similarly to how we handle it in this video, but I have a SP-specific tutorial on dealing with multivalue people columns here: ua-cam.com/video/LYu3wqb2Nx4/v-deo.html
Thank you for your amazing guide! I've been following your step-by-step walkthrough starting from the part.1 video, and when I try to change the .json file source, an error code shows up saying this:
Expression.Error: We cannot convert a value of type Record to type List.
Details:
Value=[Record]
Type=[Type]
Can you help me solve it? Thank you in advance.
Did you maybe use the folder connector instead of the file connector? I don’t think it should be trying to convert anything to a list.
@@bi-ome Thank you for answering. I think the problem was solved by itself when the source was updated the day after haha.
I am getting this same effort when I change the source. Do you have any insight? Thanks!
you are the 🐐
🤣
Amazing video!! Super helpful. Quick question: the filtering does not seem to work with labels and assignees. I’d like to be able to filter with individual labels but they’re showing up as they are in the cell (i.e « Short Term, Review in progress ») when I would like to be able to filter with « Short Term » and « Review in progress » individually.
Also, is there a way to get priority value from the planner? I looked and it seems to be related to a « getresponse_v3 » action for Planner but I couldn’t find it in the list.
You have to go through date time timezone type to get to date. So in Power Query, convert to date time timezone first as a step, then add another step to convert to date. It will ask you if you want to replace the other conversion step or not, say "no" to that to keep them separate. You don't need to do anything in Power Automate, it just doesn't like to go directly from something with letters in it to date. :)
@@claudiemalette5974 This is addressed in part 3 of the series here: ua-cam.com/video/mqGFbIGpCcw/v-deo.html
@@bi-ome thanks so much!! You and your tutorials are life savers.
@@bi-omeI was so confused because this is the third video, but I just realised I was using the assignee from the task table to filter and not the assignees from the assignee table 🤦🏻♀️
Hello,
i have a problem with the following, assigned people who appear correctly in the stream
for example, in the flow 2
when I expand the column in the report, more appears and different contacts are displayed.
what could be the reason for this? thanks.
Would you share the stream
Did you reset the assignees variable at the end of the loop? If you don’t reset it to blank, it will keep tacking people on as it loops over tasks into the one field.
Hi Christine!
I'd like to add a few columns to Tasks table... Count of subtasks related to each task, Count of Completed tasks and Count of Uncompleted tasks... Any suggestion?
😇
UPDATE for those interested:
CALCULATE(COUNTROWS("correct_table"), Filter1, Filter2, etc) resolved count of subtasks
Totes, other person covered it but I'll add that the subtask completion is a true/false field. In my dataset, I changed it to text, because for whatever reason DAX *hates* filtering on whether something is boolean true/false. So for example, the completed would look like this:
Count Completed Subtasks = CALCULATE(COUNTROWS(Subtasks), Subtasks[isChecked] = "true")
Just change to false for not complete and remove the filter for all. :)
Thank you so much, Christine! This is absolutely amazing!!
Has anyone else encountered an error parsing the json file from SharePoint? The data is fine when I open the json file I downloaded to my local drive intoPower Query Editor, but as soon as I change the source from the local drive to the SharePoint site, it looks like the taskId file is being expanded in a weird way that is iterating 5 taskIds over each task which results in 5 times the rows. Really weird because it's pulling fine from the local drive, so the file is the same, just accessing from a different location. I'm not sure what would be the trouble.
Update, I completely closed Power BI and opened back up. When I re-signed back in to access the SharePoint, it worked fine.
I had something similar happen, except when I connected the downloaded json file the tasks were iterated 5 times as well. Same task name and description, different task IDs
Similar problem here. Is everything okay with the file in the download folder! However, once I transfer it to the SharePoint path, it triples the results.
Is it possible for the data to be sent in an email instead of Power BI?
Depends what format you’re talking. It’s definitely possible, if you have Power Automate handle the whole thing the tricky part is getting it in the structure you want it because you’re dealing with a lot of multi value fields - so you have to append each of those to strings to get them in a flatter format.
You can also query a PBI dataset and email, I have a couple videos on that. For this particular data it’s almost easier to do that depending on which fields you need.
Power BI also has email subscription features in the service, but PDF attachments are premium.
Hi Christine
In Power BI I have added a graph (line and stacked column chart) to show count of completed subtasks (Y axis) for each month (I put Task completion date in X axis) and it is working fine. I tried adding average completed subtasks for each month, but I'm getting wierd results.
How would you represent a chart showing count of completed subtasks for each month with also the average? Then, I'd like to have the possibility to filter this chart based on Assignee
Thanks in advance ♥
Not sure if your dataset has multiple projects - are you looking for a count by project, then an average across all projects? Or the overall average for just the one project? There's a feature in the third tab of visual settings to add an "average line" that will auto-get the average of whatever measure you're using - that'll be the flat average across all dates. Or if you want the average across all projects by month you'd probably use COUNTX() to iterate over VALUES() for projects, counting completed, then divide that by a count of the total number of projects as a variable. A date table is useful too, not sure if you're using one or not - that will let you show multiple measures on a single calendar axis.
Oh and for the assignees, you just drop the assignee name from the Assignees table into the filter pane. That's why we made it a separate dimension - make sure the filter direction on the table relationships is going towards tasks, you may need to set it to bidirectional.
@@bi-ome I tried "average line", because that would be exactly what I was looking for, but it returns results I do not understand
Hi,
I'm on the step where you add a calculated column for ' Flags' and it's coming up with 'A single value for column 'Flags' in table 'Flags' cannot be determined. This can happen when a measure formula refers to a column that contains many values without specifying an aggregation such as min, max, count, or sum to get a single result.' Anything I can change to make it work?
@@kaitlinsmith7202 Make sure you have a table relationship between flags and tasks and that the filter direction is set to both. And make sure you’re actually making a calc column, not measure (the buttons are v close). It’s possible to make this as a measure, too, but the syntax would be diff.
@bi-ome I think that's the bit i'm struggling with making a calc column, I have done the other 2 things and my formula looks the double of yours, which button makes the calc column because i'm inserting a column
@bi-ome i've done every one of those things and recreated as a calculated column and the same error message is still appearing
@@bi-ome got it now! Just can't do the automatic refresh step hahah
@@kaitlinsmith7202 Good job! to auto-refresh, just publish to a workspace and schedule it there. I have another video on scheduling refresh on datasets with SP datasources if that helps.
Hi Christine, thanks for the great video, it really helps! I have two questions:
1. How do you handle changes in the input Data, for example you want to add a new flag?
2. When I use "show empty data" in my table, it wont add to each status an icon. Which is strange, because in each Status cell I have a value?
Thanks for your content and help !
If you want to add a new flag, you just tack it onto the data array where the rest are. The problem you'll run into is if the different projects are using different flags, there's not a great way to handle them. I'm not sure why your icons are disappearing when you show items with no data - when I toggle that on in mine the icons stay in... 🤨
Hi there - did what Christine say work for you in adding new flags? I tacked new flags onto the data array where the rest are, but they don't show up in Power BI, just the old ones...
@@DarrenCoyle-co5br Make sure to refresh the query, it caches old data for weeks if you don't refresh. Also check the "remove other columns" step to make sure they're selected to keep there. Off the top of my head the navigation step might reference by column name too.
Hi Christine, when it comes to my buckets they're only showing one set of data instead of the other buckets any idea why this may be? And also how can I have it so that multiple flags will appear on a set task?
What does one "set" mean - like all of the tasks show the same bucket in the export? If that's the case, then there's an issue with either your filter array or you might have the wrong card inserted in the main data array.
I thiiiink I covered the multiple flags - we pull them into a separate dimension table, relate the tables on task ID, then use CONCATENATEX() to get the flag names comma-separated. You have to think about it like database storage, where there are related records, they're not simple text on the items... that's the only way you can still, say, filter on flag name and have it work properly (think of it like a relational database).
@@bi-ome So it looks like there is a bunch of duplicates for each entry to cover each bucket name but when I remove the dupes it leaves me with only one of the bucket names left I've gone through and double checked and not sure where the original issue may lie.
@@rekan4277 It sounds like your bucket filter isn't working, so it's inserting the full bucket list for each. I would check the filter array step - and make sure that the value you're using in the end append step is referencing the filtered array output too, not the unfiltered card. The filter array is @{item()?['bucketId']} is equal to @{items('For_each_task')?['bucketId']}
I am just wondering if you can do video on the Task comments, it involves something using the graph API on power automate, I have usecase to extract the latest comment but I am not sure if that's overkill.
also find it silly microsoft have all these products and they still want to jump over hoops to get them connected
I don't think the comments are in the API at all. If you find something to the contrary let me know!
@@civilservant4843 It's because they want you to buy premium Planner, there are less hoops on that one. :)
As soon as I change the source url from my downloads to the share point copied link, all my data with complete dates go away and I am left with only not started tasks. Any thoughts on what I might be doing wrong?
Do the files actually have the same content? You can check the file size for an indication
@@bi-ome I had concern of that as well so I let the power automate flow re-build the json file again and download the updated version. The file in my downloads is the same size as the Sharepoint file. I tried again today and when I first open the file from my downloads it shows 999+ rows but when I link the Sharepoint site it goes down to 800 rows.
@@NicolePhillips-ui5hi Make sure to refresh in the query editor, it will cache things - and check if you have any filters applied. If you're just switching the file path from one place to another, and the file content is exactly the same, there is no reason I can think of why it would come back with different data--
@@bi-ome Why I didn’t think to refresh the query is beyond me. That fixed it. Thank you so much!
@@NicolePhillips-ui5hi Hooray for simple solutions!
I cant expand my assignees more than once, I dont understand what Im missing :(
Does it give you the columns to expand? If not check your step that is appending to the assignees variable and make sure you both have it structured the same and have the right dynamic content inserted. Typos in the array will break it too.
@@bi-ome I went back and watched everything and saw I missed one teeny detail "," its fixed and running! Thank you SO much!
I opened my JSON file that I built based on the first video, but it's all in one column. Did I do something wrong in creating the JSON or did you do something to expand the columns that's not shown in this video? New to PowerBi!
Try expanding it in PBI and see what it does. It will usually auto-expand, but that will tell you if it’s a problem or not - if it’s valid JSON it’ll let you expand it, if it gives an error you may have a typo in your append to array somewhere.
@@bi-ome I found a rogue comma, removing it seems to have fixed it but thank you for replying! Very much appreciated
@@bi-ome Spoke too soon, columns are fine when I use the downloaded file but as soon as I link it to the sharepoint file, the columns stay split out but becomes all error - seems to still think the rogue comma is there but it's not :(
@@bi-ome I changed the location in Sharepoint where the file is saved to, and that seems to have fixed it :)
I seem to be getting quadruplet entries per task ... how can I fix this?
Is that happening in the JSON file or just in PBI? If it’s on the PBI side, make sure you’re not expanding subtasks or assignees in the main tasks table. If it’s in the JSON itself, make sure your loops are all looping over the right thing-
@@bi-ome It is in the .json file, however, I re-watched the previous video and can't seem to find the issue.
@@MariaAreMoj I would hover over the apply to each task loop dynamic content card and make sure you're looping over an output from the 'list tasks' step. There's lots of very similarly named and colored dynamic cards in here and it's really easy to click one from a different step - if you are looping over something with more than one value per task, it'll be doing the append to array multiple times for the same info.
@@bi-ome Thank you!
Hello, when I contacted json I am only getting one column call list it has task id etc…no other columns nothing else any suggestions?
Does it let you expand tasks in the column header? If not then it sounds like there's a typo in your "append to array" that has all the fields in it - if you miss a comma, quote, or bracket it messes everything up
@@bi-ome exactly you super genius !! But now when I insert downloaded file I am getting all columns but when I copy paste link from SP it come back to same one column. I just rebooted my system.
@@NP-zr3jz You need to push the "refresh" button inside the query editor - it caches the old data, this will clear it :) btw there's two refresh buttons, one in the query editor and one in the report view
👍exactly It worked, thank you so much!
Ok, sorry I am new to this and questions can be dumb!
So I able adjust all tables per your instructions in query . I have duplicate Task names with different task id, and can’t creat relationship, any advise why I have duplicate task name? And can’t create relationship.
To be exact each task name repeated 8 times with different task id.
hello, I find the videos you have published very useful and productive. Health to your hands and labor.
i have a question - I can't get the comments, I wrote the following statements for this, but they both return a null value
what is your suggestion?
items('to each_application_task')?['value/comments']
items('to each_application_task')?['comments']
Thanks! The comments aren’t in the API right now, to my knowledge you can’t get them. :(
you know you could just export to excel and how powerbi split and unpivot - This is harder than just coding the stuff
This method is something you can schedule, and extend to all your plans with minimal extra effort. At the end, it’s 100% automated including the refresh. Higher initial setup time, less ongoing.
Thanks!
You bet!
Your videos are so helpful! I am a project manager that needs to monitor all tasks not assigned to me among a lot of plans, so this has been life changing. The only issue is that my flow runs FOREVER because I have so many plans/groups (like 60+). Do you have any tips for improving this? Thanks!
Do you actually need all 60+ plans? If not, you can loop over a list of the specific ones you need using their IDs instead of getting all. Now that I think about it, that's probably a good quick video topic, might put that on my shortlist...
But honestly, premium Planner is not a bad route to go for orgs that are super-heavy Planner users - only the project managers need a license, and it's not ultra-expensive - for those you can get the data out without using Power Automate at all.
@@bi-ome Thank you! We don't task in all the plans, but may in the future. I can probably clean some up, but probably not enough to make the flow better or worth doing them individually listed in a loop. I will look into premium!
@@bethanymosher9102 I did an intro video on premium here if that helps at all! ua-cam.com/video/PhTwhN7m6Lw/v-deo.htmlsi=Vb17fh-hoXkVs641