How to Graph the Equation y = 1/x (y equals one over x)

Вставка
- Опубліковано 2 бер 2023
- In this video where we're going to graph of the equation y=1/x.
We'll start with the completed graph on-screen and we're going to work backwards. That means the graph for y = 1/x has already been completed and we're going to try and understand how it was constructed.
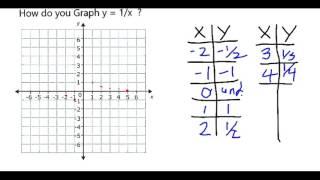
Let's start with the equation y=1/x. One thing to note about this equation is that we can put in any value for x and find the corresponding value for y. This means that we can plot any point on the line by selecting a value for x and then finding the corresponding value for y.
For example, if we put in x=1, we get y=1/1=1. So, the point (1,1) is on the graph. Similarly, if we put in x=2, we get y=1/2=0.5. So, the point (2,0.5) is also on the graph.
We can repeat this process for any value of x and find the corresponding point on the graph. This is because the equation y=1/x defines a curve that passes through all of these points.
So, there you have it the graph of y=1/x by working backwards. Remember, we can put any value in for x and find the corresponding value for y, and that point will be on the line.


Te entendí mejor que a mi maestra y eso que usted habla inglés y mi maestra Español y yo no se inglés 😅
Good explanation
If we put 5,6,7,..... Then y will be constant but it should be inverse. Why???
Nice one bro❤
Thank you!
Thank you
Thx bro
Anytime!
Eu sou legal
dont say n word plesase
n word please@@beamboy07
@@eyb0ssihebacencer539 say the n word im not watching please
We need to stop thinking of historical "progress"(Y) as a positive linear correlation with time (X) and allow for the possibility that all sorts of knowledge has been understood and implemented throughout history, some of which we don't even understand now.