Very good explanation video. Thank you for publishing this! Nice animations. Nice variance-bias illustration. Maybe just consider explaining a bit better the color map for the cars dataset toward the end. Seems to be a jump from the previous part of your presentation.
Thank you for the video. I have a more higher-level, conceptual question. You mention that prediction using linear regression is far easier for future outcomes. What is the use in not having a modeling technique that both analyzes past data or a specific data set and then predicts future outcomes? Why must LOESS be separate from linear regression?
The distinction is in extrapolation. If x data ranges from 1 to 3, less is more flexible. But if you predict for a future data point x=20, the less isore prone to predict an extremely large number. Hope that clarifies!
@@theactuarialdatascientist ah so LOESS is better for larger data sets while linear is more for smaller sets? One thing I am struggling with is the lack of equation associated with LOESS so I suppose that’s where the source of my questions lie.
@vercot7000 yes the technical term for 'lack of equations' is called non-parametric. LOESS is going to be higher variance lower bias compared to an OLS, and the more data you have the less of a concern the variance (although it still should be considered)
I have a loess model that I am applying this to in python for uniform time series data, ie financial stock data. The only issue is that when applying RMSE for predicted vs actual values, it will always select the smallest span because this will give the minimum error. Is there a way to optimize for uniform data?
Not sure what you mean by uniform data. But the reason that the RMSE is the best for the smallest span is you dont have a train vs. validation split. You need to minimize the RMSE on the validation data that the model is not built on. On a different note, I'd make sure to confirm that you are not accidently cheating with the time series data. e.g. for fitting the curve, you only use past point to predict future points. You don't want to use the left and right neighbors for time series analysis.
5:30 in this example data spans from 0 to 2.5. In the validation data set, lets say there is a point with an x value of 3. You would then take the 20% of the Training data closest to 3 and fit the corresponding curve. The validation data is used to determine the x value of interest, but the prediction curve to generate the prediction at the given x comes from the training dataset. Let me know if that doesnt make sense
@The Actuarial Data Scientist i have 50 days dataframe in which I m using loweess smoother to smoothen price. Once I get LowessSmoother output , I using get_smoother api to calculate low and up values on that smoother price . Every time I run this code , I m getting different values of up and low with same dataframe. Please help to understand why this is happening. Thanks for your help in advance smoother = LowessSmoother(smooth_fraction=0.1, iterations=1) smoother.smooth(df['Close']) low, up = smoother.get_intervals('prediction_interval') In above example low and up is always coming with different values . Thanks
Not sure what language or app it is but looks like it might be using bootstrapping to create the confidence intervals. Do the changes from run to run lessen if to put in a much larger value for itterations?
@@bhaveshvarshney222 Not large dataset.... instead of "iterations=1" in your function call try "iterations=500" and then does it changes less? Also saw you are doing a PI not a CI, which creates even larger bands in the first place, still influenced by the estimate for variance that I'm guessing is due to bootstrapping
Thanks for the explanation. You say at 2:22 that there are spline techniques which use more advanced transformations of x. Do you have any examples of this?
Generalized additive models (GAM) can use Cubic Splines. Instead of the different transformations being determined by different degrees to exponentiate by, transformations instead vary by a subtraction of x. So instead of x, x^2,x^3..... you can have (x-.1)^3, (x-.2)^3, (x-.3)^3... The values used in subtraction (.1,.2,.3) are referred to as "knots". Hope that helps!
Good stuff! I have seen somewhere else that you can also give weight to the estimations you calculate according to the distance to the real values you collected. Did you cover this in the video? I might have been to tired for to get it.
Thanks Miguel! At 3:57 I intrude the tri-cubic weighting. Of the 20% of data that is used to create that local estimation, the selected gray dots that have a closer x value to the blue point of interest will have more weight shown by the histogram/curve at the bottom of the graph. Please let me know if this doesn't make sense or if you had something else in mind!
@@miguelguerreiro5280 I'm afraid I'm not sure what you are referring to. If you can find a link to send me to help me understand what you are referring to that would be helpful. I don't think this is what you are asking, but I would conceptualize a comparison happening on the y-axis as being the regression itself. The span/tricubic weight determines which points to use and the weight to attribute to data point but the y values then affect the final prediction curve used to predict the given point. Sorry if this is more confusing than helpful! For the cross validation error, that comes back to the span and trying to determine which span results in the best model performance (distance between actual vs predicted y-values). So while the y values matter, they aren't used in the weighting of the model itself.
@@theactuarialdatascientist ua-cam.com/video/Vf7oJ6z2LCc/v-deo.html Here he does a weighting in the response variable. It is the only other iteration on LOESS where such step is taken.
Interesting! I haven't seen that before in documentation for Loess functions but perhaps there are other packages that do that? You also could do this manually by adding a weight variable where you calculate the error terms and use those. You didnt miss anything in my video though, as I did not cover this method. The cross validation used to select the best span is trying to address the same issue however.
Here is a question that the answer is probably super obvious. Isn't performing the uniform weighting or the tri-cubic weighting 'binning' the data? As I say, I am probably missing something...but how do you reply to people who tell you that you are just binning your data and binning is bad. Thank you.
[Why its not just binning] I think 'binning' typically refers to taking averages of groups. For example, your prediction for when x is between 0 and 10 is the average y value for all data with x's between 0 and 10 (aka Weight of Evidence [WoE] coding). Or, alternatively, you can convert the numeric variable into bins to then treat each bin as a categorical level. kNN is taking the average of all y values of data with x's between 0 and 10 to get a prediction at x=5... and then the average between 1 and 11 to make a prediction at 5.5, etc. [Down sides of binning] I think the main criticism of binning is you can select bins such that you are more likely to achieve statistically significant results if you mean WoE coding. This is also a potential negative for creating categorical levels as well as the potential for resulting coefficients in your model not matching the univariate trend you are seeing (which in insurance models is typically frowned upon). [Down sides of kNN compared to binning] As is the case with comparing almost any two modeling algorithms, there is a trade off of flexibility, explain-ability, and chances of overfitting. Since this algorithm is so flexible it is going to be prone to overfitting if you arent cautious in your cross validation. [how do you reply to people who tell you that you are just binning your data and binning is bad] Assuming this is being asked by the department of insurance I'd ask them to be more specific in why they think it is bad and then once I get a specific concern, I'd do my best to describe how I controlled for potential downsides (e.g. cross fold validation to ensure I'm not overfitting) All this being said, I feel like I'm arguing with myself as I try to infer what you mean by 'binning is bad'. I think even binning has its place given the right context. But please let me know if I missed the mark on what you meant by binning is bad; hope this was helpful!
@@theactuarialdatascientist I really appreciate your thoughtful answer. It is very helpful. What software are you using in these demonstrations? Thank you again, I really appreciate your thoughts.
@@theactuarialdatascientist These visualization were amazing! Did you use the gifski pacakge for the animated slides? I'd love to access your source code to use in my own teaching if you had them on a github repo :)
Thanks @@ivstat1845 I added the code file here, please feel free to let me know if you have any questions: github.com/TheActuarialDataScientist/LOESS/blob/main/Plot%20Examples.R
Great video! Just one thing (hopefully constructive feedback haha), maybe you want to speak a bit louder next time. Your voice is cracking very much, which is a bit hard to listen to. Maybe imagine speaking to a crowd instead of a microphone.
The same way a normal regression would be. The important difference is that it would only be using a subset of the data so will likely be higher variance. E.g. predicting y at x=10 using the 20 percent of data closest to 10 in the simulated data
@@theactuarialdatascientist But wouldn't we just have a flat prediction going forward akin to a KNN regressor? Because the LOWESS model coefficients are 'hard coded' based on the last values in the sequence
@@theactuarialdatascientist would you please tell me for second order polynomial and tricube weight function, which lines should I implement? I appreciate your time. I don’t have any knowledge in R
Hi MK! Pick a span, and get the model predictions vs the actual values. Calculate your error metric of interest, I would recommend the Root Mean Squared Error (RMSE). You do this by taking the squared difference between the predicted and actual. You then take the average of all of those values, and finally take the square root of that average value. You then repeat this calculation on all of your models that were built with different spans. You then select the span that has the smallest RMSE on your validation dataset. Hope that helps!


One of the best explanations I've found on LOESS method. Those animations do make a difference, thanks for the video!!
That makes me so happy to hear! My pleasure Max!
I totally aggree
@@theactuarialdatascientist Thanks a lot, I wish this code was available in MATLAB.
Thanks for all these animations. They make a huge difference.
Best video on LOESS for MAS 1. You're the man.
Thanks Bjjc!
loess circling back to knn made me grin. "math, you sneaky little fella, you're doing it again".
btw, thanks for the upload ^^
Glad I'm not the only one to find that interesting!
Very good explanation video. Thank you for publishing this! Nice animations. Nice variance-bias illustration.
Maybe just consider explaining a bit better the color map for the cars dataset toward the end. Seems to be a jump from the previous part of your presentation.
Very well explained and easy to follow! Great!
Thank you so much Bastian!
Well done! I concur with Max below. Thank you for your efforts.
Thanks Kenneth, much appreciated!
Best explanation! Makes so much sense!
Super explanation! Thank you!
best video on Loess
Thanks Muralimohan!
What excellent job you‘ve made!
Excellent explanation. Thank you for sharing your knowledge.
Thanks ilusoriob! And my pleasure!
Thank you for the video. I have a more higher-level, conceptual question. You mention that prediction using linear regression is far easier for future outcomes. What is the use in not having a modeling technique that both analyzes past data or a specific data set and then predicts future outcomes? Why must LOESS be separate from linear regression?
The distinction is in extrapolation. If x data ranges from 1 to 3, less is more flexible. But if you predict for a future data point x=20, the less isore prone to predict an extremely large number. Hope that clarifies!
@@theactuarialdatascientist ah so LOESS is better for larger data sets while linear is more for smaller sets? One thing I am struggling with is the lack of equation associated with LOESS so I suppose that’s where the source of my questions lie.
@vercot7000 yes the technical term for 'lack of equations' is called non-parametric. LOESS is going to be higher variance lower bias compared to an OLS, and the more data you have the less of a concern the variance (although it still should be considered)
Very good explanation, perhaps bias variance trade off couldve been skipped
I have a loess model that I am applying this to in python for uniform time series data, ie financial stock data.
The only issue is that when applying RMSE for predicted vs actual values, it will always select the smallest span because this will give the minimum error. Is there a way to optimize for uniform data?
Not sure what you mean by uniform data. But the reason that the RMSE is the best for the smallest span is you dont have a train vs. validation split. You need to minimize the RMSE on the validation data that the model is not built on.
On a different note, I'd make sure to confirm that you are not accidently cheating with the time series data. e.g. for fitting the curve, you only use past point to predict future points. You don't want to use the left and right neighbors for time series analysis.
Don't understand how do you apply it to an independent validation set?
Aren't the points of the validation set used in order to fit the curve?
5:30 in this example data spans from 0 to 2.5. In the validation data set, lets say there is a point with an x value of 3. You would then take the 20% of the Training data closest to 3 and fit the corresponding curve. The validation data is used to determine the x value of interest, but the prediction curve to generate the prediction at the given x comes from the training dataset. Let me know if that doesnt make sense
Why it gives different values of low and Up when use lowess get interval api. Please explain
I dont understand what your question is, can you please rephrase? Are you asking why predictions change when you use a different span?
@The Actuarial Data Scientist i have 50 days dataframe in which I m using loweess smoother to smoothen price. Once I get LowessSmoother output , I using get_smoother api to calculate low and up values on that smoother price . Every time I run this code , I m getting different values of up and low with same dataframe. Please help to understand why this is happening. Thanks for your help in advance
smoother = LowessSmoother(smooth_fraction=0.1, iterations=1)
smoother.smooth(df['Close'])
low, up = smoother.get_intervals('prediction_interval')
In above example low and up is always coming with different values . Thanks
Not sure what language or app it is but looks like it might be using bootstrapping to create the confidence intervals. Do the changes from run to run lessen if to put in a much larger value for itterations?
@@theactuarialdatascientist thanks for your reply. This code is in python. I used on very large dataframe also and same issue is seen
Please help here
@@bhaveshvarshney222 Not large dataset.... instead of "iterations=1" in your function call try "iterations=500" and then does it changes less? Also saw you are doing a PI not a CI, which creates even larger bands in the first place, still influenced by the estimate for variance that I'm guessing is due to bootstrapping
@@theactuarialdatascientist max iterations it allowed is 6
Thanks for the explanation. You say at 2:22 that there are spline techniques which use more advanced transformations of x. Do you have any examples of this?
Generalized additive models (GAM) can use Cubic Splines. Instead of the different transformations being determined by different degrees to exponentiate by, transformations instead vary by a subtraction of x. So instead of x, x^2,x^3..... you can have (x-.1)^3, (x-.2)^3, (x-.3)^3... The values used in subtraction (.1,.2,.3) are referred to as "knots". Hope that helps!
@@theactuarialdatascientist Ah cool, makes sense! Thanks :)
Thank you very much
Good stuff! I have seen somewhere else that you can also give weight to the estimations you calculate according to the distance to the real values you collected. Did you cover this in the video? I might have been to tired for to get it.
Thanks Miguel! At 3:57 I intrude the tri-cubic weighting. Of the 20% of data that is used to create that local estimation, the selected gray dots that have a closer x value to the blue point of interest will have more weight shown by the histogram/curve at the bottom of the graph. Please let me know if this doesn't make sense or if you had something else in mind!
@@theactuarialdatascientist sorry, I meant on the y-axis. I believe you touch it when you talk on error?
@@miguelguerreiro5280 I'm afraid I'm not sure what you are referring to. If you can find a link to send me to help me understand what you are referring to that would be helpful. I don't think this is what you are asking, but I would conceptualize a comparison happening on the y-axis as being the regression itself. The span/tricubic weight determines which points to use and the weight to attribute to data point but the y values then affect the final prediction curve used to predict the given point. Sorry if this is more confusing than helpful!
For the cross validation error, that comes back to the span and trying to determine which span results in the best model performance (distance between actual vs predicted y-values). So while the y values matter, they aren't used in the weighting of the model itself.
@@theactuarialdatascientist ua-cam.com/video/Vf7oJ6z2LCc/v-deo.html
Here he does a weighting in the response variable. It is the only other iteration on LOESS where such step is taken.
Interesting! I haven't seen that before in documentation for Loess functions but perhaps there are other packages that do that? You also could do this manually by adding a weight variable where you calculate the error terms and use those.
You didnt miss anything in my video though, as I did not cover this method. The cross validation used to select the best span is trying to address the same issue however.
Here is a question that the answer is probably super obvious. Isn't performing the uniform weighting or the tri-cubic weighting 'binning' the data? As I say, I am probably missing something...but how do you reply to people who tell you that you are just binning your data and binning is bad. Thank you.
[Why its not just binning] I think 'binning' typically refers to taking averages of groups. For example, your prediction for when x is between 0 and 10 is the average y value for all data with x's between 0 and 10 (aka Weight of Evidence [WoE] coding). Or, alternatively, you can convert the numeric variable into bins to then treat each bin as a categorical level. kNN is taking the average of all y values of data with x's between 0 and 10 to get a prediction at x=5... and then the average between 1 and 11 to make a prediction at 5.5, etc.
[Down sides of binning]
I think the main criticism of binning is you can select bins such that you are more likely to achieve statistically significant results if you mean WoE coding. This is also a potential negative for creating categorical levels as well as the potential for resulting coefficients in your model not matching the univariate trend you are seeing (which in insurance models is typically frowned upon).
[Down sides of kNN compared to binning]
As is the case with comparing almost any two modeling algorithms, there is a trade off of flexibility, explain-ability, and chances of overfitting. Since this algorithm is so flexible it is going to be prone to overfitting if you arent cautious in your cross validation.
[how do you reply to people who tell you that you are just binning your data and binning is bad] Assuming this is being asked by the department of insurance I'd ask them to be more specific in why they think it is bad and then once I get a specific concern, I'd do my best to describe how I controlled for potential downsides (e.g. cross fold validation to ensure I'm not overfitting)
All this being said, I feel like I'm arguing with myself as I try to infer what you mean by 'binning is bad'. I think even binning has its place given the right context. But please let me know if I missed the mark on what you meant by binning is bad; hope this was helpful!
@@theactuarialdatascientist I really appreciate your thoughtful answer. It is very helpful. What software are you using in these demonstrations? Thank you again, I really appreciate your thoughts.
My pleasure! All of these plots were created using R.
@@theactuarialdatascientist These visualization were amazing! Did you use the gifski pacakge for the animated slides? I'd love to access your source code to use in my own teaching if you had them on a github repo :)
Thanks @@ivstat1845 I added the code file here, please feel free to let me know if you have any questions: github.com/TheActuarialDataScientist/LOESS/blob/main/Plot%20Examples.R
GREAT!
Great video! Just one thing (hopefully constructive feedback haha), maybe you want to speak a bit louder next time. Your voice is cracking very much, which is a bit hard to listen to. Maybe imagine speaking to a crowd instead of a microphone.
How can a non-parametric LOESS regression be used for extrapolation?
The same way a normal regression would be. The important difference is that it would only be using a subset of the data so will likely be higher variance. E.g. predicting y at x=10 using the 20 percent of data closest to 10 in the simulated data
@@theactuarialdatascientist But wouldn't we just have a flat prediction going forward akin to a KNN regressor? Because the LOWESS model coefficients are 'hard coded' based on the last values in the sequence
@@vzinko only if you chose degree=0 then it would be flat.
What is kNN?
k-nearest neighbors
Pity you didn't supplement videos with stata code! - excellent video
Great
Gracias
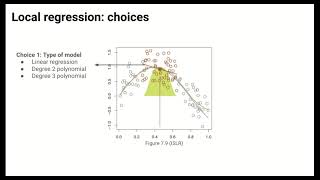
May I know what does it mean when we right degree = 1?
You fit a degree = 1 polynomial. So it fits a y=c+Bx regression. Degree =2 would be a y=c+Bx+Dx^2 and so on. Hope that helps!
@@theactuarialdatascientist for me is 2. Thanks.
@@theactuarialdatascientist thanks a lot. I am trying to write this code in MATLAB.
@@fahimesokhangou3646 My Pleasure! Unfortunately I do not know anything about coding in MATLAB, but hope the tutorial makes coding that up easier!
@@theactuarialdatascientist would you please tell me for second order polynomial and tricube weight function, which lines should I implement? I appreciate your time. I don’t have any knowledge in R
I don't understand how to check the validation error please?
Hi MK! Pick a span, and get the model predictions vs the actual values. Calculate your error metric of interest, I would recommend the Root Mean Squared Error (RMSE). You do this by taking the squared difference between the predicted and actual. You then take the average of all of those values, and finally take the square root of that average value. You then repeat this calculation on all of your models that were built with different spans. You then select the span that has the smallest RMSE on your validation dataset. Hope that helps!
@@theactuarialdatascientist I think I got the idea but I'm not sure I can execute it well. Yeah, thanks so much
@@emkahuda776 Do you mean how do you write the code to do this? Or something else?
@@theactuarialdatascientist yes, write the code. I'm so bad at coding tbh 😪
@@emkahuda776 Gotchya! I plan on making a LOESS coding tutorial at some point in the future but unfortunately haven't made it yet, sorry :/
I am searching such a great code in MATLAB