How to perform gage R&R analysis to determine repeatability and reproducibility

Вставка
- Опубліковано 4 сер 2020
- The R&R calculation template I use in this video can be downloaded through: www.tommentink.com/gagernrtem...
Or check out my full course that takes your through a gage R&R study from setup through execution to interpretation of the results: www.tommentink.com/offers/UAK...
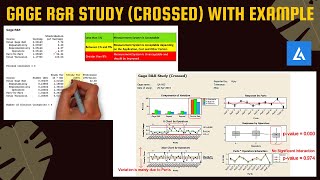
An important part of Measurement System Analysis (MSA) is to know how good the Repeatability and Reproducibility (R&R) of your measuring tool is. This video shows how to set up a gage R&R analysis and how to do and interpret the calculations.
0:49 - Accuracy, Precision and Stability explained
2:22 - Setting up an R&R analysis
3:55 - Calculating the R&R indices
7:38 - Interpreting the values
9:10 - special cases: 1 of the indices is good, the other is not
#continuousimprovement #sixsigma #lean


@Tom, thanks a lot for the video. Wish you all the best
Your illustrations are really convincing. Keep it up buddy. Subscribed
Thanks for the confidence and happy to have you aboard!
Great video Tom! Perfectly outlined.
Thanks for the compliment, Kevin. I’m happy you enjoyed it.
I’ve got a whole bunch of “when, why and how” videos on R&R and related topics, like SPC, Cpk, etc. So be sure to check out some more on my channel.
Enjoy your learning!
This was such a great video! Thank you Tom!!
Thanks, Sally, for letting me know you liked it!
If you've still got open questions about R&R (of some other performance excellence tool), don't hesitate to ask - I'm always happy with questions that inspire new videos.
Thank you so much for the explanation
Happy to hear you found it useful
Excellent. Thank you.
Thanks for sharing that, always nice to hear people are enjoying my content.
If there's any other topic you'd like covered in a future video, feel free to suggest 😉
Sensational, thanks for sharing!
Happy to hear that you like it!
If you have any questions or requests, don’t hesitate to ask 😉
Great video. Thank you.
Thanks, glad you liked it.
Feel free to share other topics you’d like me to explain.
Very nice explanation
Thanks!
Ahw mate... this was really a great explanation! Thanks for sharing your knowledge.
My pleasure, I'm glad you found it useful and thank you for sharing that!
@@TomMentink Hey Tom. I have downloaded the excel template to calculate the GRR value of our test system. It seems that the mfg process is extremely stabile so the value baed on the observed variation is not relevant, we need to use the GRR index based on tolerance. What I have noticed is that your excel template provides a slightly different value than minitab. (1.2% vs 1.47%). Have you noticed anything like this? Thanks.
@@helpmepls5698 This can happen due to a slightly different way of calculating the standard deviation. I believe MiniTab uses an SD calculation based on each subgroup, my file uses an estimation based on the average range. The general results will be very similar, but you can see such small differences. If in doubt, trust MiniTab more - they make a really good program and keep all their statistics up to date.
Be careful when sampling for Gage R&R - you need to sample the full range of the process, so make sure you've got some of the edge cases (or right-out defects) too and get products from different batches. Of course, you might have a process that's just super capable - kudos to you!
Hi, I am co-teaching this class and I'm looking forward to introducing this work to my cohort of apprentices. I'm hoping to prepare by following along the video with the calculation template. Thanks!
That's so great to hear, Sherri: using my videos to learn and then help teach others - love how my work is able to help so many people.
Very nice video and explanation - only one thing : If the result is RED is clear, is needed an improvement. If is Yellow we can use this type of measurement but we are "forced" to improve our measuring system. Green is also clear. My question: Yellow is between what percentage? Thanks
Watched this to better understand Gage R&R for an upcoming green belt exam. Can't say I completely understand the concept quite yet but I am more educated than previous to watching so thank you for that!
Hi Nicollette, first off: thanks for the comment and good luck with your exam. Difficult to say from your comment what part of the R&R concept you’re struggling with most, but here goes:
The first mental hurdle for most people: all measurements are wrong, that is no measurement is right 100% of the time.
Precision vs Accuracy: not precise means that you get different answers every time you measure the same thing (lots of variation in the measurement results), not accurate means that the results are structurally off to one side of ‘the truth’. (in gage R&R you can’t really see this problem if it’s in the measurement device itself, you can only see it if one person creates a different bias than another). So low precision always shows in R&R, low accuracy only when it’s due to the person using the device.
R&R checks if the measurement gives the same result every time, including when different people use the measurement device:
When you give the same part to one and the same person 3 times, you would expect to get similar results. This is called repeatability - will exactly the same part get precisely the same results with the same person. This is also called equipment variation, because we assume that this is mainly due to the measurement equipment.
You also give the same parts to several different people to measure. You would again expect similar results for the same parts, but we already know that there’s some variation due to the equipment (the repeatability variation is usually not 0) - now if there’s more variation between the people than there was between parts, we assume that there’s a second effect, namely who operates the equipment apparently also affects the result: there’s operator variation, or in R&R words, we cannot precisely repeat the measurement using a different person.
Then you see that we measure many parts, this has two reasons: first off, more measurements gives a more reliable result, but the second thing isn’t directly obvious: we use the measured differences between those different parts to estimate the variation between parts (this has nothing to do with the measurement system, this is the variation in your process) - the final R&R value is when you divide the variation you observed when measuring the same part several times by this process variation -> if the variation in the measurement is 30% is not acceptable.
Hope that helps a bit more!
Sorry to add to the confusion: you can use R&R to compare different measuring devices instead of different people, repeatability is then the measure of difference between the devices. (but I don’t think they’ll ask that at the exam)
@@TomMentink This was a very helpful alternative explanation! Thank you!
Hope you passed your exam, if you're still interested in the story behind that d2 or what's the deal with average of average of ranges - check out my new video: ua-cam.com/video/kwN-MkuGSQw/v-deo.html
@@TomMentink That is interesting. So is it possible to compare two different (automatic) measuring devices with regard to R&R? What do you have to take into account?
@@gabrielconnor5455 you can use gage R&R on any set of measurement systems that should give you the same result.
So in stead of different operators with the same equipment, you can also take different measuring equipment or even compare different labs.
The whole setup of R&R is that you compare variance between identical measurements (repeatability) with variance between operators/labs/external factors (reproducibility).
Amazing video. How do we get the file you showed in the video please? Thanks
For those of you interested in some deeper understanding of gage R&R, specifically what those numbers and formula are doing - I made a companion video to this one, go check that one out too: ua-cam.com/video/kwN-MkuGSQw/v-deo.html
And for some interesting further viewing, I strongly recommend this video by Paul Allen about the usefulness of MSA/R&R for OEE measurements: ua-cam.com/video/Jpi7PIJ2Pl4/v-deo.html
Amazing coaching. I have a question. If I want to test different parts and check the repeatability and reproducibility, then how to calculate GRR? The part to part variation will be very big.
So the idea is that you take the full natural spread of 1 type of part - that is, as long as it’s supposed to be sold as the same product, take the longest, the shortest and a whole bunch of average parts your process is turning out: this is to represent the part-to-part variation in the sampling.
Don’t take different products into one GRR, that way you introduce a larger part-to-part variation into the calculations than you have in the actual process and the basic premise of GRR will no longer be valid (it compares the variation from the measurement to the variation in the product itself).
What you can do, is to make multiple GRR studies (one for each different product) and draw comparisons between the outcomes - if between-operator-variation is relatively big for all products, you should probably look into training and standardization, for instance.
Hi Tom you do a very good job explaining things. Could you please share the EXcel template link?
Thank You
Hi Sanjay, please see www.tommentink.com/gagernrtemplate to download the template. (If that download link doesn't work, send a reply to one of my emails and I'll sort out the back end)
Excelent video. I've recently done a study 2 Op x 3 tr x 10 parts, but couldn't assure the wide production range, so I produced 2 OOS out of 10 parts. What do you think?The inspector said I had to include the preparation explanation of the samples in the protocol.
What you have pointed out is extremely important. Enough variation in parts is very important. If there is no in-built variation then the variation due to operator and equipment cannot be understood. I had also done exactly the same thing. OOS parts are mandatory. Could you please add to this Tom?
Hi Tom, thanks for your great video. What is relevant for deciding which method ANOVA vs. X bar & R in minitab to choose? Or is it all the same which method you choose?
If you’re using minitab anyway, I’d choose ANOVA, because it is a bit more accurate and slightly friendlier to the measurement system (just not as easy to do on the fly or with Excel).
In any case we’re talking about small differences between the methods.
@@TomMentink Thank you. I will try it out. How many measurements should be aimed for? To obtain adequate results.
@@gabrielconnor5455 general rule of thumb is 10-15 samples, that are each tested 2-3 times by 2-3 operators. More samples will give more precise results, but in practice you don’t gain a lot of extra precision when going above 90 or so measurements.
One extra thing to note with regard to ANOVA - it NEEDS to use part-to-part variation as its measure of total production variation (you cannot manually enter a specification range), so make doubly sure that the parts you sample represent a good broad range from your production. (This is also very much preferred when using X bar & R, but in that one you can always check against specs as a back up)
@@TomMentink Thank you very much for the useful advice. I did not know that a specification range cannot be specified manually in the ANOVA method.
Just launched a full course on doing a gage R&R study, which clarifies the goal and purpose of R&R and then takes you through the whole process of setting up the study, sampling, the calculations (both range method and ANOVA), drawing correct conclusions and getting you on your way to improving the measurement system - really practical way to assess measurement systems and devices in your organisation: www.tommentink.com/offers/UAKshqwj
In my experience, not many people consider the possibility of the measurement device itself being inaccurate -> what are your ideas on how to raise this topic with colleagues?
I agree, as long as the measuring device has a calibration stamp on it the operator trust the device is producing accurate measurements. I've experience steel rulers were bent and warp but still used because the calibration stickers was withing the expiration date.
@@odhoward6808, wow, hard to imagine if I hadn’t seen similar things myself 😉
I hope you had little trouble convincing them that these rulers were no longer useable. Did they blame the calibration technician for not noticing it, or were they self aware enough to admit that anyone using a piece of (measuring) equipment should also use their own common sense?
Unfortunately this has happen on more than one occasion. Some of them took ownership and others blamed the calibration team. This was a culture issue that we are still working on today. I believe people naturally want to do the right thing but pick up bad habits when they find out those habits are tolerated. In your experience what systems or process help improve awareness of keeping a quality mindset throughout the day.
@@odhoward6808 two things usually stick out: Leadership (especially frontline leader, like shift leaders) should set the example on caring about quality; and putting critical parts of a process step into instructions and explaining why it’s critical (if you follow TWI, training within industry, methods, you’ll see that this is standard practice for that shop floor instruction style).
i wasn't too sure why the certain g values were chosen and how was that table for d2 value look up was made..
It's good to see that this type of understanding about the R&R calculations is desired by you (and hopefully other viewers - please let me know 😉). In fact, pushed by Nicollette's previous comment I decided to make a companion video on what those calculations are trying to do, including more explanation of why m, g and d2 change with different sample sizes. (I won't fully calculate those d2 values - that's a level of statistics that I'm not comfortable teaching either 😊)
I just finished shooting, but still have to edit and make the animations -> it’ll be out next week Wednesday, I’ll keep you posted!
The video is out! ua-cam.com/video/kwN-MkuGSQw/v-deo.html
Very well explained Gage R&R study using X-bar R values. Do you have R&R study using ANOVA? If you do, can you share the link for video & maybe the Excel file as well? thank you
Thanks for your kind words.
I haven’t got an ANOVA video or file yet. Might be good to set up some time. I just find this method to be much easier to distribute and that usually gives me better adoption in the organization, which leads to overall better checks on our quality system than using the slightly superior, but much harder to teach ANOVA method.
Great video, is there any way you could share your excel file? Also, can you explain the difference between attribute vs variable gauge R&R? Thank you
Hi Saman, I've dusted off that Excel template - it's now available through: bit.ly/GageRnRtemplate
Initially had some trouble with the link, it should now work, but if it's not, please let me know.
It's a great video again, thank you so much! I have a question for you. In manufacturing and when we evaluate if a machine is ready for production. We have to do Gage R&R and Cpk, but I don't know about the relationship between Gage R&R and Cpk
For example, "Gage R&R % of tol." "Cpk value" "Result (Only Gage R&R >= 10 need to be analyzed)"
< 10 - OK
10 - 30 > 1.66 OK
10 - 30 1,33 - 1.66 Case dependent OK or NOK
10 - 30 < 1,33 NOK
Can you explain it to me, please?
Oh wow, that’s a nice brain breaker how to explain - I’ll probably do a video about it sometime soon, because I’ll need more than a few lines of comment text 😉
The short of it is that when Cpk is high, you’ve got quite some leeway between production results and tolerances. So when your measurement system gives a bit of an off reading, it’s not likely to cause any out of tolerance parts.
But at Cpk 1,33, your results already give a couple parts per 1000 defects even when your process is perfectly centered. If your measurement system introduces about 30% extra observed variation, there is a big risk that you won’t see process shifts before you’re way over tolerance limits with a sizable part of production (several percents of parts) and there will also be too many analysis results that falsely fall on ‘the wrong side of the tolerance limit’ (good parts registering as defect or defect parts registering as OK).
@@TomMentink Thank you so much! I can't wait to watch the next video.
@@Tom-dn5de that video I promised you is up: How gage R&R and Cpk are linked in six sigma
ua-cam.com/video/znE7ykJl4io/v-deo.html
Hope you enjoy it!
@Tom
Appreciate the video. Very helpful.
Can you share the Excel file as well? Please and thankyou
I uploaded it to G drive - you should be able to access and download it (not edit) with this link: drive.google.com/file/d/1G7fbO3u9nRNIra80wgy6tRF8j67Gy7p1/view?usp=sharing
Please let me know if it works or not.
@@TomMentink It works. thanks a ton!
Hi Tom, voor mijn scriptie wil ik een Gage R&R uitvoeren waarbij ik de procestijden van twee processen wil meten. Hoe zou jij aanbevelen om de gage r&r te meten? 2-3 operators, en dan 2 parts (de 2 processen) en elk 10 metingen of iets dergelijks? De procestijden van de twee afzonderlijke processen verschillen wel telkens, bij het ene proces duurt een handeling tussen de 1,9 en 2,8 minuten en bij het andere proces duurt een handeling tussen de 22 en 32 seconden. Ik hoor graag van je!
Hallo Max, waarom zou je gage R&R gebruiken om procestijden te vergelijken? De methode is heel geschikt om de precisie van een meetapparaat te vergelijken met de variatie in het product dat je meet (komt meer of minder dan 10% van de totaal gemeten variatie door het meetsysteem?).
Als je de procestijden van twee processen wilt vergelijken, kun je beter een 2-tailed t-test doen. Die kijkt of er een significant verschil is tussen twee ‘populaties’ (in jouw geval een setje metingen van de tijden van je beide processen) - daarbij houdt de berekening rekening met de variatie in de procestijden van hetzelfde proces. (een klein verschil in gemiddelde, bij processen waarvan de tijd keer op keer flink verschilt, is niet significant)
Als je het effect van verschillende operatoren wilt vergelijken met het verschil tussen de beide processen, dan kun je wel een ANOVA doen (zoals je bij een gage R&R ook kunt gebruiken), maar noem het dan geen gage R&R, van je bent niet de “gage” (oftewel meetapparaat) aan het beoordelen.
Overigens, met een verschil van ~3,4m en ~27s hoef je niet veel berekeningen te doen om te zien dat er een significant verschil is.
Dus bepaal eerst duidelijk voor jezelf welke onderzoeksvraag je wilt beantwoorden. Daaruit kun je beter bepalen wat een goede testopzet en statische methode zijn.
Hi Tom, Is subscribed but I couldn't download the template! Could you please send me other options?
Please send a reply to the download email and I’ll manually send you the file.
Hello, Happy new year§ I have the case 1: I have good R&R index based on tolerance, but poor R&R index based on observed variations, for sure, the samples we selected are not covering the range, what I want to know in this case, can I conclude that R&R study is conform as I have R&R index based on IT OK?
Happy New Year to you too!
Great practical question! Yes, it’s generally OK if you have a good index compared to specs. If your company or client insists on a high Cpk (like 2) or if your process is really not centered, you might want to take that into account when judging your measurement system, but in most instances your results tell you that your measurement is good enough.
Hello, thanks for your explanation, but I'm still confused why we have 2 methods to interpret the result, and which method in which confguration I should use, could you please help me? thanks in advance@@TomMentink
@@liseaimejaychou Firstly, there's not always a specification range, so you can't always use the comparison to specs (the ANOVA method also cannot do this, by the way). Secondly, your measurement system should help you control the actual process, not just some values put to paper (hopefully your specifications are quite close to practical values, but that's not always the case).
Thirdly, if you want to keep a high process capability, your measurement system should also be good enough compared to that actual process output (whose standard deviation is 9-12 times smaller than the specification range).
An ideal measurement system has enough precision for both actual results and specifications. But if it hits around 10 on one comparison and still under 30 on the other, it's generally good enough for your process.
Since many people take a too limited sample for R&R, that doesn't cover the whole range that the process produces (you're not alone in that 😉), using this double check system is a great way to spot that shortcoming in sampling.
what is the the origin of the array of constant d2 please ?
The table I use comes from the Ford MSA manual, I got it through Efeso consultancy during my green belt training years ago 🤷♂️
The origin of the D2 value itself is that it’s the expected range between M samples from a normal distribution with a standard deviation of 1. If you do that lots of times and average the results, you’ll get those values at the 15+ row; if you do it fewer than 15 times, there is an additional correction to get a better estimation (that’s gG)
So basically what the formulas do is check the range between your samples and divide by the corresponding D2 value to estimate the standard deviation from that.
I 've watched your video, I have a question, how to get theses % Contribution?
% Study VAR?
% Tolerance?
NDC?
% Contribution.
Hi Catherine, thanks for your question - it’s not totally clear to me, so if my reply doesn’t really answer your question, don’t hesitate to ask some more details.
First of, please also check my video on the workings and ideas behind R&R: ua-cam.com/video/kwN-MkuGSQw/v-deo.html
The % of studies variation and of tolerance are SqRoot(the part that operator-variability plus repeat-variability), which is the StDev of R&R, compared to the total observed StDev of the process (this is % of study far); or 5,15 x StDev R&R (which is the spread that contains 99% of the measurement errors) compared to the specification range. The contribution (of the measuring system) is the division in the previous comparisons: how much of the total observed variation is due to the measurement system.
Don’t recognize NDC.
what happens if bias fails but cgk is good type 1 study
When your measurement system precisely gives you the same bias, you will structurally affect the process or product you’re using that measurement for.
If you use it for SPC, you might get away with it, but practically, it’s always better to do a proper calibration to remove or correct for the bias.
Gage R&R will not find a bias, unless you’re comparing multiple measurement systems to one another. Therefore make sure you have a calibration process in place next to R&R testing.
Do you a link to the excel sheet?
Yes I have, Bill, i you you just want to use that R&R template: www.tommentink.com/gagernrtemplate
But you can also check out my brand course (just launched yesterday, so I'm pretty excited about sharing that with you 😉) that takes your through a gage R&R study from setup through execution to interpretation of the results: www.tommentink.com/offers/UAKshqwj