In the fifth column which is MC, there must be 0.3 instead of 0.33 (30 divided by 100) It makes no big difference of course, just as a matter of fact. Lots of Thanks for your lessons, they are really helpful for my exam prep.!!)
Really these should be two different graphs. A productivity graph should show output (vertical axis) per worker (horizontal axis). A cost graph should show dollars (vertical) per unit of output (horizontal). The reason the productivity curve is so wonkily shaped in this video is I'm showing how marginal product changes as output increases. When I make a new version of this video I'll draw two graphs: one showing marginal product as labor increases and one showing marginal cost as output increases. Then they'll both look like nice neat parabolas, mirror images of one another!
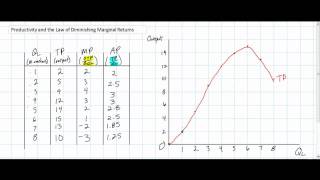
At 400 units of output our MP becomes 25 (which is less than 33.3 - previous MP). So, as per the concept, once the MP starts falling - our AP should also fall. Here, at 400 units of output - our AP becomes 23.5 which is greater than 23.1 (previous AP). PLEASE EXPLAIN.
From the point MP starts to fall, AP should also fall but when we look at the diagram - before AP starts to fall - MP is increasing as well as decreasing (yes MP>AP). But as per the logic - increasing MP will only lead to increasing AP. As soon as MP starts to fall, AP should also fall. Please explain
I need practice about economic analysis of production and cost please coz I have an exam even a link but please with answers to correct it thanks in advance
So how is one to figure this table out when the quantity of capital is not given. All I have is price of labor, and price of capital, and a large blank table 🥴? Idk if I’m missing something or my Econ Professor just wants to see me pull my hair out...
The marginal product is how much output the last worker hired contributed. It can be found by dividing the change in total product the change in the number of workers. If the change in workers is ONE, then it's just the change in output. If the change in the number of workers is more than one, then you'd technically be calculating the "average" MP... since you're determining how much output changed PER additional worker hired.
From the point MP starts to fall, AP should also fall but when we look at the diagram - before AP starts to fall - MP is increasing as well as decreasing (yes MP>AP). But as per the logic - increasing MP will only lead to increasing AP. As soon as MP starts to fall, AP should also fall. Please explain
You are incorrect. AP rises as long as MP is above AP, even if MP is falling. AP only starts to fall when the marginal product is less than the average product.


You're an amazing teacher Jason!
instablaster
U explain everything important in a very easy method.
You are the bomb!
THANK YOU MAN! my professor explain it in the most complex way possible for us to understand -.- which makes it almost impossible for me. I LOVE YOU!
Sir your way of teaching is very simple and easy to understand. I hope I will get 90+ in microeconomics.
I just came here to listen to your intro song.
In the fifth column which is MC, there must be 0.3 instead of 0.33 (30 divided by 100)
It makes no big difference of course, just as a matter of fact.
Lots of Thanks for your lessons, they are really helpful for my exam prep.!!)
This is awesome! Thank you so much for this lesson!
I enjoy watching your video, very easy to understand. Thank you so much!!!
You are seriously amazing! Thank you so much. This actually makes sense.
Thanks.This really is what I would want to describe as Micro Economics made simple.
what the intro of the song is ?
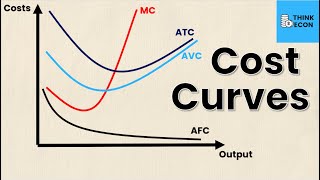
what are the costs that increase after you produce beyond your optimal level of output?
Nice video. Practically speaking, when graphing this, how do you set the scale for P and C so that it comes out proportionally ?
Really these should be two different graphs. A productivity graph should show output (vertical axis) per worker (horizontal axis). A cost graph should show dollars (vertical) per unit of output (horizontal). The reason the productivity curve is so wonkily shaped in this video is I'm showing how marginal product changes as output increases. When I make a new version of this video I'll draw two graphs: one showing marginal product as labor increases and one showing marginal cost as output increases. Then they'll both look like nice neat parabolas, mirror images of one another!
Thank you Mr. Welker. And why do MC and AVC originate from the same point; in later lessons there is a vertical distance between them?
great lesson and great explanation!
At 400 units of output our MP becomes 25 (which is less than 33.3 - previous MP). So, as per the concept, once the MP starts falling - our AP should also fall. Here, at 400 units of output - our AP becomes 23.5 which is greater than 23.1 (previous AP).
PLEASE EXPLAIN.
From the point MP starts to fall, AP should also fall but when we look at the diagram - before AP starts to fall - MP is increasing as well as decreasing (yes MP>AP). But as per the logic - increasing MP will only lead to increasing AP. As soon as MP starts to fall, AP should also fall. Please explain
I need practice about economic analysis of production and cost please coz I have an exam even a link but please with answers to correct it thanks in advance
Thank you so much. This does really help me to understand. ;)
best teacher
Thanks a lot, this is Great! Can you reference your video, didn't know the order to follow
Talk to me sometime.
Neal
Looks like micro economics stuff?
Thank you so much.
marginal cost at 300 units of output should be 30/100=0.3, not 0.33. Anyways, great explanation! many thanks:)
Excellent 👌
ua-cam.com/video/eZMX_q-YLZY/v-deo.html
So how is one to figure this table out when the quantity of capital is not given. All I have is price of labor, and price of capital, and a large blank table 🥴? Idk if I’m missing something or my Econ Professor just wants to see me pull my hair out...
ua-cam.com/video/eZMX_q-YLZY/v-deo.html
Very effective sir
thanks you
amazing!!!
Thank you
Very helpful
Thanks for the video, But please please please, its not beh-gal its Bay-gel
thanks very helpful
Thank you :)
awesome thank you very much
in another video, you calculated MP in a different way and here it's different, totally confusing
The marginal product is how much output the last worker hired contributed. It can be found by dividing the change in total product the change in the number of workers. If the change in workers is ONE, then it's just the change in output. If the change in the number of workers is more than one, then you'd technically be calculating the "average" MP... since you're determining how much output changed PER additional worker hired.
thank you
it is nice
Good
ua-cam.com/video/eZMX_q-YLZY/v-deo.html
Wow
begles ..LMAO
HAHA IKR that was so distracting, since i'm from the south and we say BAAAAAAYYYY-guhls
Begles... bagels with a demand curve is so high customers beg for increased production.
asap please
This isn't the correct arrangements of Some Formulae....i totally disagree with u sir 😊
From the point MP starts to fall, AP should also fall but when we look at the diagram - before AP starts to fall - MP is increasing as well as decreasing (yes MP>AP). But as per the logic - increasing MP will only lead to increasing AP. As soon as MP starts to fall, AP should also fall. Please explain
You are incorrect. AP rises as long as MP is above AP, even if MP is falling. AP only starts to fall when the marginal product is less than the average product.
thank you