Usually, color remain the same after translation. However, if you intend to change it, it's changed in the usual manner from the top right menu. Thanks
I have already shared tutorials regarding adding and editing references. Links of the videos are as follows. Thanks ua-cam.com/video/RyCyj_Q1FE4/v-deo.html ua-cam.com/video/YFHpyUK8L4M/v-deo.html
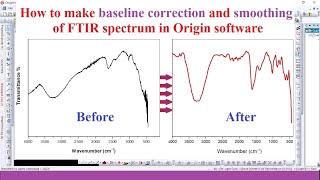
Assalamu Allaykum sir, kal mera thesis submission hy, FTIR k graph nhi bna sk rha, Q k us mein transmittance ki range bht km 99.99 se 100.00 tk hy, me kya kro kindly suggest, me BI2O3 borate glasses per kaam kr rha hn
I don't think there's any issue with your FTIR plots. The usual plots data is like yours. You plot them as y offset, as discussed in the following video. Thanks ua-cam.com/video/QgmtDdXiTWY/v-deo.html
It's a sample graph for learning. It may or may not represent the article figure. By the way, I don't know what's the need of it being in an article. Thanks 😊


A pleasure (as always!). Thank you very much
Thanks for the appreciation dear. Please share it with others too.
❤❤ amazing
Thanks dear
Thanks Dr SB for making such a nice videos..
Thanks for the appreciation dear 😊
this is toooo goodddd..tq sir
Thanks for the appreciation 😊
Ty for your service, sir.
You're welcome dear
Very helpful for me.thanks
Glad to hear that. Thanks
Very helpful
Glad you think so!
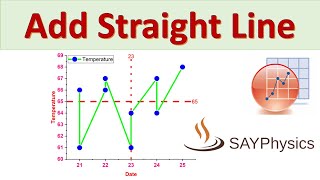
How to change the colour for lines after curve translation
Usually, color remain the same after translation. However, if you intend to change it, it's changed in the usual manner from the top right menu. Thanks
Great job thank you
Thank you too!
Please make a video about adding references easily
I have already shared tutorials regarding adding and editing references. Links of the videos are as follows. Thanks
ua-cam.com/video/RyCyj_Q1FE4/v-deo.html
ua-cam.com/video/YFHpyUK8L4M/v-deo.html
Sir please do a lecture series on statistical mechanics 🙏
Sure, I'll do so IA. But first, let me finish with the ED and QM. Thanks
Assalamu Allaykum sir, kal mera thesis submission hy, FTIR k graph nhi bna sk rha, Q k us mein transmittance ki range bht km 99.99 se 100.00 tk hy, me kya kro kindly suggest, me BI2O3 borate glasses per kaam kr rha hn
I don't think there's any issue with your FTIR plots. The usual plots data is like yours. You plot them as y offset, as discussed in the following video. Thanks
ua-cam.com/video/QgmtDdXiTWY/v-deo.html
Have you published this data in your article? Can you share the DOI number?. Thank in advance
It's a sample graph for learning. It may or may not represent the article figure. By the way, I don't know what's the need of it being in an article. Thanks 😊
Hi
How I contact with you ?
You may contact me by en email sayphysics@gmail.com. Thanks
please use another sound rather than music, a quran or a sound of nature. or use your sound to discuss to are you doing
Right dear. Noted with thanks 👍