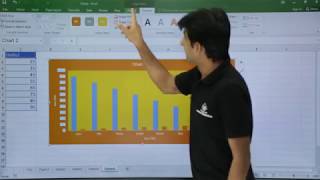
MS Excel - Pie, Bar, Column & Line Chart

Вставка
- Опубліковано 30 лип 2024
- MS Excel - Pie, Bar, Column & Line Chart
Lecture By: Mr. Pavan Lalwani Tutorials Point India Private Limited
Check out the latest MS Excel Online Training courses on bit.ly/38Jyu3p
Use coupon "UA-cam" to get FLAT 10% OFF at Checkout.
Check out latest Video Courses and eBooks : www.tutorialspoint.com/market...
In this videos know How to Make A Pie, Bar, Column & Line Chart in excel, Charts & Graphs in Excel Tips and Tricks ?
For more updates on courses and tips follow us on:
Facebook: / tutorialspointindia
Twitter: / tutorialspoint
LinkedIn: / tutorialspoint


To Get Certification, Click Here: bit.ly/38Jyu3p
Use coupon "UA-cam12" to get ‘’FLAT 12%’’ OFF at Checkout.
They used your vid as a reference in my online class.
😂
Same
*Seriously, your tutorials r fantastic⚡*
_My learning curve is getting upgraded to new levels for ex the combo chart I've done first time. For that I am grateful._
Fabulous teaching! Spellbound, anybody can learn from this video.
Outstanding because of simplicity and specificity! A joy!
It was so clear to understand. Amazing demonstration. Thank you. Much appreciated.
Thanks a lot ...tutorial for the select data option was very helpful
Great sir .....you provide a great knowledge to people .
Thanks
This channel is one of the best channels I have ever come across thnk u so much
You have an exceptional skills of teaching. Brilliant. Please mention the part of the chart video so that there will be sequence to know the things in order. Thanks for the video. Keep up the good job.
Thanks very much . great as usual. very well explained
Thank you very much Mr. Pawan
I can't deny the fact that I have learned a lot from your tutorials. Thank you
Thànk you Sir ...... Your Teaching Method is Really Awesome ..... I Learn More things from your Channel.
You are amazing boss.. nicely explained ❤️
You are the best teacher in the world -thank-you sir
Thanks sir i am a student of 7 class and i litterelly did no study on this chart and you save my life
BEAUTIFUL PRESENTATION AND ALSO YOU HAVE GOOD TECHNICAL STUFFS
Such an amazing teacher
Thank you so much Sir. Its very helpful. Love from Eastern Nagaland.
Thank you.. very well explained me
Dear Sir, I am your devoted fan...the bundle of thanks ...very well explained, Abdul Majeed from Lahore, PK.
Thank you, you have made a difficult task very simple for me. very grateful
Thankyou... right video at the right time..... helped it in my exam
You are a great teacher.
Very good demonstration of the charts.
Such an amazing teacher!! Thank you.
Great job dear, It really helped me a lot. Thank a lot.
great presentation! thank you!
Very nice and peaceful presentation. I love and enjoyed full presentation.
Thank you sir.
Thank you for this tutorial. Well explained and versed. Thank you so much :)
great job,, i learned a lot,,, much appreciated
Thank u so much...it has helped me in various interviews
Thank you.. very well explained..
Thanks for explaining 😊
Thank you so much sir 😊
Thanks for such a nice explanation
Wow really amazing explanation sir 👌
Teaching skills are awesome sir
Such a great nice teacher
The way you teach it is just awesome
Thank you sir.. Ur teaching method is extraordinary
Thank You sir ❤
Hi
Which is the best chart for showing experience profile in CV ? Please help
thank you sir much appreciated
Pavan, What a brilliant video. Really amazingly explained. Well done and Thanks.
your teaching style is so awesomeness
thank you so much.. well explained.. dear sir..can u please give me the very first you tube video link of yours?
Is the plus(+) sign that allows the graph to be edited strictly associated with a particular excel version or all versions please?
thank you so much yarr...........................
Thank you so much 💕
Unique way to teach Excel Online!
Your teaching way is good
sir it is well understood but can you tell me which version MS OFFICE is this as i can not get sorting option in the chart
Your teaching way is awesome
Thanks better explained
Hi
In excel I m not able to see Combo chart in chart types.
Please help
Sir you are really teaching nice , I really like your style of teaching
Your 😁 Teaching skill is very awesome thanks for the video
i am very helpful this video thank you bro
Well explanation sir👌👌👌
Very clearly explained hats off
Best explanation sir
Awesome video sir.
Really very nicely explained
such a great explannation lots of love from Pakistan
Explanation next level 👌
Worth watching
👌👌👌
Thanks
Well explained. Appreciated
It was really best work done by you sir it was really help for us thanks a lota sir
Very good video I understand everything in exel
excellent teaching method sir
Thank you sir.. your ascent is too good☺️
amazing teaching skill sir
Excellent way of explanation sir.. Really very nice lecture
Really thank you sir 😊
very nice thank you
Sir your vedio helped me alot
Yes you are bestest teacher
Hi sir, can we add data label with percentage in barchart?
You're just brilliant
I have a doubt . If we have four headings and the values are underneath that heading , if we apply the command insert pie, does the first heading only appear . I have used this in 2010 excel I guess . Can u help
Sir you are great
Great teacher ..thanks alot 💙
😃😃😃😃😃😃😃
👍👍👍🍰💪🇲🇲🇲🇲🇲🇲💪
You are great sir.
For 20 items or products how to plot a graph? Keeping the information as (quantity, rate and amount)from these 3 columns
Please help me sir
Thank you sir .
Thank you very much sir
Very well explained sir
Sir this is very important information in excel
Very much useful thankq soooooooo much
Thank you
Nice job sir👍👌👍👌
very very thank..it helped me a lo in exams
so nice chart explanation
very helpful video, thank you so much sir for this...
Can you please share the link for the previous video of formatting ?
I started to be interested in excell :P thanks
Teaching explanation is very appreciable.
Thank you sooo much