Because I focus primarily on building a right data model and spend most of my working hours on that issue, I also realised we need to separate all text values from the fact table and accomodate them in separate dimension tables so that fact table has only numeric values. I found that eases our task like nothing else. I worked on data with 12 million rows and everything worked butter-smooth only after I moved all its text values to smaller dimension tables.
Did you create index for each text dimension in PQ or you have already available from the source the index for each text of the dimension? Sometimes the source doesn’t provide this and you need to create manually, the point you are forced to create all those index in PQ.
Thank you for another great video. I find you channel one of the best PBI resources on UA-cam. Your skill of explaining complex topics in simple way is truly amazing. Recently I struggled with exactly the same granularity issue as in your video. It took me some time to figure out why my average calculations did not work 😅
Totally agree. I always follow the mantra of keeping the model simple. I resonate well with #3 - reducing columns in fact table. Too often I enter into discussions on why to use only columns that are specifically needed. And you rightly alluded to: there is the inherent human need to keep hold of something that is not needed now but want to hold on to it anyway! ;-)
Hi Chandeep, your videos just keep making me a bigger fan of urs. I have a query and need ur help pls. There are 2 data sets : One for Jan 23 and other for Dec 22. There are 300 columns and 200000 lacs in each. Objective is to compare the value of each cell and give a pivot table with the reference to those cells which are not matching. Please note that row numbers might be different in both workbooks and hence a field named "unique identifier" is used as the unique finder of the row values. Another catch is if any value is newly inserted in existing row in Jan 23, that should not reflect as a variance. Request your guidance please.
Hi sir, First of all, I watched your first video and I liked it very very much. Thanks a lot for helping the community. Also can you please suggest any of your video for Dimensional Modelling with some example (Facts and Dimensions)?
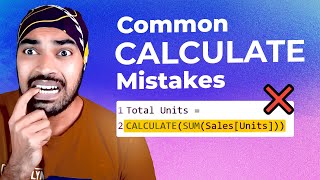
Hi, Chandeep. thank you for one more useful and interesting video! However, I have one doubt. You concluded your comment on the need to check granularity saying that the second code option would be preferrable for not triggering context transition. However, I had the impression that using a measure within another measure always triggers the transition. Do I have it wrong? A simple yes or no would suffice. Thanks again!
Using a measure in an iterator triggers context transition. DIVIDE( SUM(Acolumn), DISTINCTCOUNT(Acolumn) ) would not trigger context transition. I hope that makes sense. Here is a more visual approach to understanding context transition - ua-cam.com/video/zInhbElc8xU/v-deo.html And this one - ua-cam.com/video/pTI2ASgecGA/v-deo.html
Hi Chandeep/Goodly, another awesome video and thanks for imparting your knowledge to all of us. Big fan here. On reducing the granularity, how to model when the user is requesting for Median and Nth Percentiles on TATs (the user wants to parameterize the N) and also wants to view at variable slices/dimensions? I do want to create an aggregate table to improve the performance, however, confused about how to get the best of both worlds. Will look forward to your suggestions...
Hi. Thank you for all your invaluable videos tackling real issues faced. One question about bridge table. Do you recommande to use ‘reference’ the original table or ‘Duplicate’ table. I would go for ‘Reference’ assuming the data are loaded only once but could create some issues that I do not know afterward?
Thank you fr this nice piece of information. Do you have anything on timeline visuals that can display interactions using various shapes n colors in the timeline graph? I would love to see that.
Not thought of getting an average that way, I'd have used AvgX and iterate over the values of the sales table date, have you done a video on bridge tables for a many to one lookup? , another thins I find confusing is using an entire table as a filter. i do like these videos where you explain things, as you've done with pq records etc. Thank you for all you hard work.
Iterating over a table and providing a fact table as filter are 2 different concepts. It is the latter that you should avoid. I haven't done an exclusive video on bridge tables. Thanks I got 2 video ideas. Cheers
I have three different data sets where we have redundant values. What scheme should I use here. Is it a star schema by using another non redundant data set and add them with them remaining there or something else I can apply here. Any suggestion on this will be greatly appreciated...
I've two tables and both have many to many bidirectional relationship and these are connected with email id. For this scenario I created a bridge table and connected with 1 to many bidirectional relationship. So, when I take data from one table it takes more time then usual. is there any other way to handle the situation 😕?
My fact table coming form the database and I can't reduce the no. of columns, Is there any way to reduce them and use in our power BI report so that the report work faster, any formula or some magic steps?
Working on a complex data set and report it often becomes difficult to identify junk columns towards the end. Is there any tool that can help me identify my junk columns/measures?
Hi..i like to watch your power query videos. My question is can power query Handel multipal pivot tables. Because in my work place I gots report in multiple pivot tables files. And i have to collect data from these pivot tables and make new report as per demand. How can we automate this report..is there any way in power query....exp. in 1St pivot table i have sales person name and monthly values 2023. And 2nd pivot table again I have sales person and his 2022last year sales value.and i have to combile these to pivot tables data..i have to populet sales person and year 2022and2023 in one data set..right now I'm copying 1St data and xlookup on next table. This can do through Power query
@@GoodlyChandeep thank you sir, i wanted to ask u that I got multiple workbook in multiple pivot tables in that..using this pivot tables as per requirement i have to darg and drop fields in pivots. And help of standerd function make new report. My source data in the pivot table form.not in table..so how can we Handel multiple power pivots to extract specific data from multiple pivot and make my report
Hi Chandeep Good evening. A co-worker left company and now I need to edit a APP that he is the owner. I have to revise a few measures but and I am not able to edit them . Options to download, etc are greyed out. Is there any solution to this case? Thanks
Does using bidirectional filters in Data model has any performance issues or any chances of ambiguities? Many a times I feel using of bidirectional filters for the interactivity.
@@nishantkumar9570 It really depends on how your data model is structured and how much data you have but yes you can get performance issues with bi-directional relationships and ambiguity in your data model if you are not careful. It is best to avoid using Bi-di relationships at all in the model unless absolutely necessary.


Because I focus primarily on building a right data model and spend most of my working hours on that issue, I also realised we need to separate all text values from the fact table and accomodate them in separate dimension tables so that fact table has only numeric values. I found that eases our task like nothing else. I worked on data with 12 million rows and everything worked butter-smooth only after I moved all its text values to smaller dimension tables.
Did you create index for each text dimension in PQ or you have already available from the source the index for each text of the dimension?
Sometimes the source doesn’t provide this and you need to create manually, the point you are forced to create all those index in PQ.
I'm going to try this. Very smart approach.
Thank you for another great video. I find you channel one of the best PBI resources on UA-cam. Your skill of explaining complex topics in simple way is truly amazing. Recently I struggled with exactly the same granularity issue as in your video. It took me some time to figure out why my average calculations did not work 😅
This is excellent! Becoming my fav channel for PBI
More videos on data modelling would be awesome
Totally agree. I always follow the mantra of keeping the model simple. I resonate well with #3 - reducing columns in fact table. Too often I enter into discussions on why to use only columns that are specifically needed. And you rightly alluded to: there is the inherent human need to keep hold of something that is not needed now but want to hold on to it anyway! ;-)
We want an end to end DAX learning video with examples on row and filter context.
ua-cam.com/video/NkYwwb7I3BY/v-deo.html
ua-cam.com/video/P9Q3I9QGjGY/v-deo.html
Hi Chandeep, great to see your videos. One other best practice I follow is creating the 'Measures Table' and giving right names to the measures.
Hi Chandeep, your videos just keep making me a bigger fan of urs.
I have a query and need ur help pls.
There are 2 data sets : One for Jan 23 and other for Dec 22. There are 300 columns and 200000 lacs in each. Objective is to compare the value of each cell and give a pivot table with the reference to those cells which are not matching. Please note that row numbers might be different in both workbooks and hence a field named "unique identifier" is used as the unique finder of the row values.
Another catch is if any value is newly inserted in existing row in Jan 23, that should not reflect as a variance.
Request your guidance please.
YOU ARE AWESOME!
Thanks a lot, I really enjoy your videos, they make me understand PowerBI much better!
Best video i have seen so far on best practices. Straightforward. Many thanks 🙏🙏🙏
Wow, thanks Chris!
Hi, Chandeep! Amazing tips, thank you!
This was great video, thank you, I would love to see more "Best Practises in Power BI" Videos.
Great Video ❤ Very recently i have started following few of these practices..especially having minimum required columns in Fact👍
Your explanations are so clear and easy to understand even by beginners like me ❤
Happy to hear that Mjtr!
Awesome tips.. ✨ Thank you!
You're simply the best
Great video. Do you have a video related to a model that needs to handle millions of rows?
Hi sir, First of all, I watched your first video and I liked it very very much. Thanks a lot for helping the community. Also can you please suggest any of your video for Dimensional Modelling with some example (Facts and Dimensions)?
Hi, Chandeep. thank you for one more useful and interesting video! However, I have one doubt.
You concluded your comment on the need to check granularity saying that the second code option would be preferrable for not triggering context transition.
However, I had the impression that using a measure within another measure always triggers the transition. Do I have it wrong? A simple yes or no would suffice. Thanks again!
Using a measure in an iterator triggers context transition.
DIVIDE( SUM(Acolumn), DISTINCTCOUNT(Acolumn) ) would not trigger context transition. I hope that makes sense.
Here is a more visual approach to understanding context transition - ua-cam.com/video/zInhbElc8xU/v-deo.html
And this one - ua-cam.com/video/pTI2ASgecGA/v-deo.html
Thank you sir, for sharing these Wonderful advices. Every video from you is like a gift. Thank you again and have a wonderful day.
You are very welcome Emil!
Hi Chandeep/Goodly, another awesome video and thanks for imparting your knowledge to all of us. Big fan here.
On reducing the granularity, how to model when the user is requesting for Median and Nth Percentiles on TATs (the user wants to parameterize the N) and also wants to view at variable slices/dimensions? I do want to create an aggregate table to improve the performance, however, confused about how to get the best of both worlds.
Will look forward to your suggestions...
Thank you for this brilliant and clear explanation!!
Glad you enjoyed it Iván!
Amazing tips bro, thanks again 👍🏽
Hi. Thank you for all your invaluable videos tackling real issues faced. One question about bridge table. Do you recommande to use ‘reference’ the original table or ‘Duplicate’ table. I would go for ‘Reference’ assuming the data are loaded only once but could create some issues that I do not know afterward?
Ideally referencing
Looking forward 2nd best practices
Thank you fr this nice piece of information.
Do you have anything on timeline visuals that can display interactions using various shapes n colors in the timeline graph? I would love to see that.
Many thanks. How do creat a bridge table?
thank you, does the aggregation of the data work well with direct query?
Not thought of getting an average that way, I'd have used AvgX and iterate over the values of the sales table date, have you done a video on bridge tables for a many to one lookup? , another thins I find confusing is using an entire table as a filter. i do like these videos where you explain things, as you've done with pq records etc. Thank you for all you hard work.
Iterating over a table and providing a fact table as filter are 2 different concepts. It is the latter that you should avoid.
I haven't done an exclusive video on bridge tables.
Thanks I got 2 video ideas.
Cheers
Finished watching
Date tip might be good on some occasion but generally it's bad advice. Use instead a year column from calendar table and then make relationship..
I have three different data sets where we have redundant values. What scheme should I use here. Is it a star schema by using another non redundant data set and add them with them remaining there or something else I can apply here.
Any suggestion on this will be greatly appreciated...
Great video Bro ❤
Wow.. Fantastic.. Could you please create one video on handling many to many relationships with real time example..
Hi, Can you please bring some more videos on Relationship in Power BI
Great video again! Thanks
Glad you enjoyed it Roy!
Could you explain Type of Relationship in Power BI
2nd point can you explain once..the one with granularity
Thanks!
Thank you so much 😊🙏
I have to learn power query, dax, and power BI data modeling. But Is there any more discounted price?
here when you introduce bridge table then does it make schema to snowflake schema from star schema?
Subscribed!
what is meant by context transition in dax?
what does reducing granularity mean ?
1000. like from me
Can you help me out to how to change other parameter values when we change server name parameter at service level
I've two tables and both have many to many bidirectional relationship and these are connected with email id. For this scenario I created a bridge table and connected with 1 to many bidirectional relationship. So, when I take data from one table it takes more time then usual. is there any other way to handle the situation 😕?
What all the uses of fact tables
Awesome 👌
Thanks Srinivas!
My fact table coming form the database and I can't reduce the no. of columns, Is there any way to reduce them and use in our power BI report so that the report work faster, any formula or some magic steps?
Game changer
Thanks Lionel!
Any info about New batch?
Working on a complex data set and report it often becomes difficult to identify junk columns towards the end. Is there any tool that can help me identify my junk columns/measures?
Measure Killer
Hi..i like to watch your power query videos. My question is can power query Handel multipal pivot tables. Because in my work place I gots report in multiple pivot tables files. And i have to collect data from these pivot tables and make new report as per demand. How can we automate this report..is there any way in power query....exp. in 1St pivot table i have sales person name and monthly values 2023. And 2nd pivot table again I have sales person and his 2022last year sales value.and i have to combile these to pivot tables data..i have to populet sales person and year 2022and2023 in one data set..right now I'm copying 1St data and xlookup on next table. This can do through Power query
This might help - ua-cam.com/video/jZu3qzhNNkg/v-deo.html
@@GoodlyChandeep thank you sir, i wanted to ask u that I got multiple workbook in multiple pivot tables in that..using this pivot tables as per requirement i have to darg and drop fields in pivots. And help of standerd function make new report. My source data in the pivot table form.not in table..so how can we Handel multiple power pivots to extract specific data from multiple pivot and make my report
Is there any coupon code who really need discount to enrol course.
Hi Chandeep
Good evening.
A co-worker left company and now I need to edit a APP that he is the owner. I have to revise a few measures but and I am not able to edit them . Options to download, etc are greyed out. Is there any solution to this case?
Thanks
Can you suggest some courses to learn Power BI online?
You can check out our courses - www.goodly.co.in/products
How to create a bridge table
Create another table by using the VALUES() function, which extracts the column from the data/facts table.
I want to solution on how to deal with Many to many data model could you please make a video on it, I will provide the data via email.
send it with a clear explanation - goodly.wordpress@gmail.com
How to merge 1-1 tables?
Use a left outer merge in Power Query
ua-cam.com/video/II6nNwWB3zY/v-deo.html
How about the bidirectional filters?
Does using bidirectional filters in Data model has any performance issues or any chances of ambiguities?
Many a times I feel using of bidirectional filters for the interactivity.
@@nishantkumar9570 It really depends on how your data model is structured and how much data you have but yes you can get performance issues with bi-directional relationships and ambiguity in your data model if you are not careful. It is best to avoid using Bi-di relationships at all in the model unless absolutely necessary.
I want a discount to enroll in your power BI course
goodly.co.in/learn-m-powerquery/?