Autocorrelation and Power Spectral Density (PSD) Examples in Digital Communications

Вставка
- Опубліковано 19 жов 2020
- Two fundamental examples in digital communication systems are used to explain Autocorrelation and Power Spectral Density (PSD).
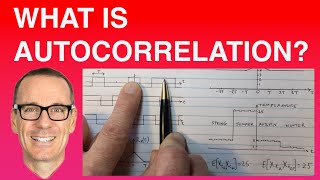
* Note that there is a small "typo" in the magnitude of the sinc function PSD that's drawn under the triangle function. The magnitude at f=0 should be (A^2)T. The triangle autocorrelation function can be viewed as the convolution of two identical rectangular functions of base T and height A/sqrt(T). The Fourier transform of that rectangular function is a sinc function with a height A sqrt(T). And since convolution in the time domain is equivalent to multiplication in the frequency domain, the Fourier transform of the triangle function will be a sinc^2 function with height (A^2)T.
** And here's an additional description that might also help with understanding the content in this video (based on a question I received in the comments under the video):
It's important to think about which random variable the expectation (ie. E[.]) is over. In this case the random variable is t_o. For some values of t_o the times t and t+tau will be within the same digital symbol period (and the value will be A*A). For other values, the times t and t+tau will be in different symbol periods (ie. the digital clock transition occurs between those two times). In this case the value will be either A*A, or (-A)*A, or A*(-A), or (-A)*(-A), with equal probability - and the average of these will be 0. So overall, the average of the first case (A^2) and the second case (0) will depend on the percentage of the realisations of t_o that are in each case. The bigger the value of tau, the smaller the chance of t and t+tau being in the same digital period. Hence the Autocorrelation function goes down as tau goes up.
* If you would like to support me to make these videos, you can join the Channel Membership, by hitting the "Join" button below the video, and making a contribution to support the cost of a coffee a month. It would be very much appreciated.
Check out my search for signals in everyday life, by following my social media feeds:
Facebook: profile.php?...
Instagram: / iainexplains
Related videos: (see www.iaincollings.com )
• What is Autocorrelation? • What is Autocorrelation?
• What is Power Spectral Density (PSD)? • What is Power Spectral...
• Fourier Transform Duality Rect and Sinc Functions • Fourier Transform Dual...
• What is a Random Process? • What is a Random Process?
• What is a Poisson Process? • What is a Poisson Proc...
• What does Wide Sense Stationary (WSS) mean? • What does Wide Sense S...
• What is a Probability Density Function (pdf)? • What is a Probability ...
• What is a Multivariate Probability Density Function (PDF)? • What is a Multivariate...
• Expectation Equation Explained • Expectation of a Rando...
• What is White Gaussian Noise (WGN)? • What is White Gaussian...
• Duality Example in Fourier Transforms • Duality Example of Fou...
Full categorised list of videos and PDF summary sheets: iaincollings.com


Your video is very helpful. Your explanation makes those abstract terms and equations becoming easy to understand!! Thanks a lot.
Glad it helped!
I never understand this topic with this clarity in such a short video Thankyou
Glad you found it helpful.
Good evening sir, I don’t know if you are still reading the comment or not but I would like to say a huge thank you for making all those useful videos. As you can see it's 2AM in the morning and I am just a frustrated college student trying to figure out how autocorrelation works because I can’t really understand what was my uni lecturer talking about. I wish you have a great day.
Glad I could help! All the best with your studies.
Awesome lectures 👌
How would you find the PSD for bipolar, Unipolar, Antipodal and Manchester?
Thanks for your amazing channel
I'm so glad you enjoy it!
Magnificent explanation!
Glad you liked it!
Thank you so much sir. You explained it so clearly
I'm glad you found it helpful.
Great video. Thank you very much
Thanks. Glad you liked it!
Wow.... I asked in the morning and you provided immediately.....might be coincidence....👍
I've been meaning to make this one for some time, but yes, your request sparked me into action. Nice one! Thanks for the suggestion.
Hello Iain, thanks for the video, very helpful. I was wondering how to interpret the value of the autocorrelation at 0? Can this be somehow correlated with the power or the intensity of the signal? Thank you
Yes, for stationary random processes, the autocorrelation at 0 is the variance (power) of the signal. By definition it is E[X^2].
Excellent video, thank you
Glad you liked it!
life-saver
Thanks for the video.Just wondering what the PSD denotes and why is important? Is the PSD of a signal with higher amplitude better than the one with lower amplitude?
The PSD shows you which parts of the frequency band are being used by the signal. Perhaps you might find this video helpful to understand some applications that make use of the frequency band information: "What is the Fourier Transform used for?" ua-cam.com/video/VtbRelEnms8/v-deo.html
Freaking amazing
Wow ...sir it was simply superb 👍
That's great to hear. I'm glad you found it useful.
I suggested this video for a newbie student some days ago. Also, I am studying and researching in telecommunication for at least 6 years, frankly I did not find any person explaining better than you...
You are the best in your profession
Thanks so much for your nice comment. I'm really glad the videos are helpful.
A more general question,please. In many source about signals, one can found the term E{y[l]*y[l]^H} > similar to your first line - is that the expression for a correlation matrix or a covariance matrix?
The corr. matrix has entries that are between -1 and +1, but how can that be? E{y*y^H} can give me values outside of that interval when the vector y has high valued entries -> so it cannot be a corr. matrix.
Can you give a short answer, please?
Thanks a lot for everything.
thank you for your outstanding videos. Is it possible for you to make a video on quasi-stationary process?
Thanks for the suggestion. I've added it to my "to do" list.
hi professor lain
why is it like finding the FT of the autocorrelation function, I mean why we are not taking directly the Fourier transform of the signal ?
to find out the power of the random signa, l is there an intuitive explanation for this
The signal is random, so you don't know which exact signal waveform you're going to get in a realisation. You could try taking the Fourier transform of every possible realisation and then averaging them, but there are infinite possible realisations, so it would take you a long time!
당신과 같은 사람이 되고 싶습니다!
I want to be a great explainer in engineering just like you!!
From S.K
That's great. Glad you like the videos.
Sir, why is the W.S.S autocorrelation function's graph is going to be a triangular, all multipication values of A*A is equal to A^2...
It's important to think about which random variable the expectation (ie. E[.]) is over. In this case the random variable is t_o. For some values of t_o the times t and t+tau will be within the same digital symbol period (and the value will be A*A). For other values, the times t and t+tau will be in different symbol periods (ie. the digital clock transition occurs between those two times). In this case the value will be either A*A, or (-A)*A, or A*(-A), or (-A)*(-A), with equal probability - and the average of these will be 0. So overall, the average of the first case (A^2) and the second case (0) will depend on the percentage of the realisations of t_o that are in each case. The bigger the value of tau, the smaller the chance of t and t+tau being in the same digital period. Hence the Autocorrelation function goes down as tau goes up. For more details on random variables see: ua-cam.com/video/MM6QM3y8pvI/v-deo.html and for more details on the expectation function, see: ua-cam.com/video/334ZWt28b_0/v-deo.html
best explanation without indian accent
Thank you
You're welcome
Hi Iain. Another very good explanation from your side. If I am not wrong, this topic might be applied to CP and ISI concepts in OFDM. The maximum distance which OFDM symbol can travel and still avoid ISI is limited by CP duration. So I understood t0 in this video as delay of OFDM symbol in LTE. If t0 is smaller, the Rx will be higher and chance to decode signal will increase (beside this, in LTE CP is a copy of signal which will increase autocorrelation furthermore)? Are these statements correct? Many thanks from Alex.
Yes, that's exactly right. Correlation of digital training data is used in "timing recovery" in many digital communications systems (not just OFDM).
1:07 in second row,
Why does x(t+T) have a star superscript? Isnt it same function with x(t)?
@soul ı am with you about complex conjugate. But i am not sure like you. Someone has to clarify us. From another aspect, as signal energy, it is used square of signal function. I intuit that, it is square because it is real form of function. Namely , square of signal function comes from general form of complex conjugate multiplication.
Yes, that's right.
Sir, even if the random process is not stationary can we still say that the auto correlation and power spectral density form a fourier transform pair
@7:14 if taw > T and less than 2T we have zero autocorrelation right ?
if this is true then for taw > 2T we will end up having again a peak in the autocorrelation
this means R(taw) should be periodic with period T , so why it is not plotted that way ?
Thanks
Maybe have another look @4.50 where I explain that for all tau bigger than T, the two times (t and t+tau) are in different digital "time slots", and since the data is random (independent), that means x(t)x(t+tau) will be equally likely to be either (1)(1) or (1)(-1) or (-1)(1) or (-1)(-1), and the average of those four values is 0.
@@iain_explains
I am asking for the case if tau greater than 2T the correlation would increase again
The data is periodic so should be the correlation function which I don't see here
I am referring to this section
Definition for periodic signals in this Wikipedia article
en.m.wikipedia.org/wiki/Autocorrelation#Definition_for_periodic_signals
No, the data is not periodic. The data comes from whatever signal/file is being sent. It might be the samples of an audio signal from a microphone, or an image file, or a text file, or a video, or whatever. It is certainly not periodic.
@@iain_explains but the plot of the signed seems to be periodic with period T
@@yasserothman4023 The period of one symbol is T, but the value (A or -A) of one symbol is a random, so the signal is not periodic. Period signal will be for example 110011001100... and this is obvious not the case here.
Hi Iain, Just FYI, some of the summary sheets of the videos for this series are not included in the corresponding sections of your website. An example is this video.
Yes, thanks for the reminder. Somehow I've misplaced the notebook pages for these videos. Every now and then I reconstruct a few of the missing ones by capturing video screenshots. I just need more time in the day to do more. Thanks for your comment - I'm so glad to hear that people are finding the summary sheets useful.
@@iain_explains I completely understand. What you are doing is amazing. Sth that might shed light on the use of the summary sheets: I used them to keep notes for myself. Basically adding a few lines here and there, so when I forgot a concept I can just look at my notes and remember things, instead of rewatching all the materials.
Yes, that's what I'm hoping people are doing. I've also found that I use them myself for exactly the same reason, when people post questions about one of my videos, and I can't remember exactly how I explained it in the video.
Sir I have a question that why the autocorrelation function of white noise is delta correleted ??
You'll find the answer here: "What is White Gaussian Noise (WGN)?" ua-cam.com/video/QfUQMzHfbxs/v-deo.html
@ 2:18 you mentioned there is a delay between transmitter and receiver but the waveform you made is of time advance it should be time-shifted by to the right side I think ... correct me if I am wrong sir
Normally we take the time reference at the receiver to be the time that a line-of-sight wave arrives (ie. we set this time to be 0 at the receiver, and plot everything with reference to that). Basically you can choose t=0 to be at any time you like (after the Big Bang anyway).
If it's a real valued stochastic process do we simply not take the complex conjugate?
Sorry, I'm not sure what you're meaning. There is no "complex conjugate" if something is "real".
Iain the GOAT 🥇
Thanks.
what an intuitive understanding !!!
I have question is PSD or Autocorrelation function of random process is deterministic and why?
Thanks for your comment. It's hard to give the explanation/intuition in these comments. I'll make a video to explain. In summary though, the PSD and Autocorrelation can be viewed as ways of characterising the random process (RP), just like the Expectation is a way of characterising a random variable (RV). The Exception of a RV is not random. It is a deterministic number that can be calculated from the PDF of the RV. In a similar way, the PSD and Autocorrelation are deterministic functions that can be calculated from the model of the RP.
@@iain_explains
Thanks a lot for your kind reply.
Your videos are like blessings for me , very intuitive and easy to grip the concept, dispels all the doubts.
Plz make more videos on these basic understanding on communication and signal processing related topics more and more. I am very enthusiastic to feel them.
Thanks in advance ❤️
It's great to hear that you're finding the channel helpful.
Why the PSD of f=0 is the highest? shouldn't the main frequency component be f= 1/T?
Great question. The Fourier transform of a particular waveform would be 0 at f=0, because it would have half +1s and half -1s (in the limit as time goes to infinity), and therefore there wouldn't be any DC offset (ie. no value at f=0). But the PSD is a different quantity. It's the density of the power (which is the square of the signal value).
Why didn't you just use Fourier properties? It makes correlation (convolution) multiplication in frequency domain. So it will be sinc(theta)*sinc(theta) = sinc^2(theta). Is there something I'm missing?
That's exactly what I said at the 7:20 min mark of the video!
How is A*-A = 0?, also R_x(3T) would be A² , wouldn't it?
Sorry, I'm not sure where you're seeing the A*-A term you mention. And I'm not sure why you think that R_x(3T) would be A². It's hard for me to answer your question, without knowing your thinking behind it.
@@iain_explains R_x(3T) is A^2 because wavelength is 3T and you'll hit either A*A or -A*-A. Between T < tau < 2T, actually R_x(tau) = -A^2/3, because you have 1/3 chance of hitting A and A or -A and -A, and 2/3 chance on hitting -A and A
@@iain_explains I guess I missed the part about randomness (only said, not visualized in anu way), it's not a sequential repeating pulse wave. Maybe add something to the video (to emphasize the randomness). Maybe I shoud start from the beginning of the series.
A^2T^2 or A^2/T?
Sorry, that's a "typo". It should be (A^2)T. The triangle autocorrelation function can be viewed as the convolution of two identical rectangular functions of base T and height A/sqrt(T). The Fourier transform of that rectangular function is a sinc function with a height A sqrt(T). And since convolution in the time domain is equivalent to multiplication in the frequency domain, the Fourier transform of the triangle function will be a sinc^2 function with height (A^2)T. Thanks for pointing it out.
sir = excellent --from which country ?= amarjit =india
Please.make ur explanation simpler and easy to understand
I'm going to make a couple of videos on the definitions of PSD and Autocorrelation. Hopefully they will help. Keep an eye out on the channel over the coming weeks.
Math w/o numeric examples is black box
very badly explained : no talks, but try to WRITE your explanations !
If you prefer written explanations, then I'd recommend you try a textbook. There are many textbooks that cover these topics.