This insanely valuable video has just 2k views and people twerking their butt has 20Mil views. This just shows how much deep in shit we are living in. Much respect to you Sir. Keep pushing!
You sir, make the most complex problem look so easy & you have opened my eyes to issues I have never thought of, or encountered anywhere else. So, I have only one word for you "RESPECT"!
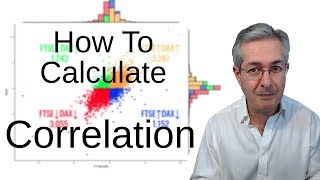
What amazing correlation map!! 👏🏼👏🏼 It's very understandable and provides good chance to choose assets that shows low correlation. Thanks! Cheers!! 👍🏼😀👏🏼
You are legit the only person who did what I was looking for from 2yrs and was doing my own research but it’s taking so much time. Wondering if you can share this sheet and in a new tab I’ll drop my research (same R2 value setup) and pass the sheet back
By using r squared you miss on the negative correlations, which are even more valuable than the uncorrelations. What could be used to preserve the negative symbol?
I understand how it is beneficial to have uncorrelated assets in a portfolio. But, if one has a winning position in a given asset, would there THEN be a good reason to also be looking for an opening in a correlated asset?
Taking correlated assets will make you win more but also loose more. To avoid that , we want to make our returns maximum while minimizing the volatility (because taking correlated assets will increase the volatily i.e the risk). Read about "Markowitz effecient Portfolio"


This insanely valuable video has just 2k views and people twerking their butt has 20Mil views. This just shows how much deep in shit we are living in. Much respect to you Sir. Keep pushing!
You sir, make the most complex problem look so easy & you have opened my eyes to issues I have never thought of, or encountered anywhere else. So, I have only one word for you "RESPECT"!
This is the Gold mine.
Thank you Martyn
What amazing correlation map!! 👏🏼👏🏼 It's very understandable and provides good chance to choose assets that shows low correlation. Thanks! Cheers!! 👍🏼😀👏🏼
Super interesting Martyn. One of your best and more usefull videos.
Thanks dear Martyn for another great content.
you never fail to amaze. thanks Martyn
Awesome content Martyn, thank you very much :)
Hello, it would be wonderful if you made the table available for download
Brilliant, thanks!
It would be nice to have that excel sheet!
I agree. 10k%.
Just use R or Python, you can do easily
You are legit the only person who did what I was looking for from 2yrs and was doing my own research but it’s taking so much time.
Wondering if you can share this sheet and in a new tab I’ll drop my research (same R2 value setup) and pass the sheet back
Is there anyway, the file could be available to us?
Hi Martyn. Could you please be so kind to share your color criteria? Thanks
Nice!
Martyn - as always it is very valuable information!
Is there a way to obtain that correlation heat map file?
Hi is it possible to obtain this correlation table? Download?
By using r squared you miss on the negative correlations, which are even more valuable than the uncorrelations. What could be used to preserve the negative symbol?
Maybe multiply the r2 with the slope of the line... Dunno
I understand how it is beneficial to have uncorrelated assets in a portfolio.
But, if one has a winning position in a given asset, would there THEN be a good reason to also be looking for an opening in a correlated asset?
Taking correlated assets will make you win more but also loose more. To avoid that , we want to make our returns maximum while minimizing the volatility (because taking correlated assets will increase the volatily i.e the risk).
Read about "Markowitz effecient Portfolio"
Sir share the excel sheet
Why didn't you calculate negative correlations?
Can't have negative values with r squared