your videos are AMAZING. I tried all weekend to understand this material and I couldn't. But after watching your videos everything is clear now. I thank you a lot. You are a genius
That is great to hear! Hope you did well on your final too. I do have channels on Economics, Calculus and Algebra too. You can see links to these on the MyBookSucks Facebook Page (see link in video description).
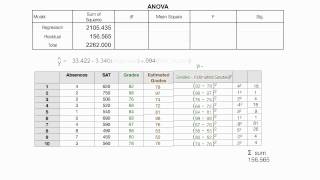
Yes you are correct! Good catch, I will revise those graphs. I have it labeled incorrectly. Grades are the dependent variable because they "depend" on absences and SAT score. I mention that right in the first part of the video.
First I want to thank you for your helpful tutorials. Its really nice how you explain the statistics involved, but why don't explain the interpretation as well. Like what F-score really mean and what significance stand for. It will help a lot in applications of statistics like Hypotheses testing. Oh and what kind of software you used for your presentation ? :)
Hello Prof. Longstreet, Thanks heaps for uploading the videos. Your videos are incredible to learn stats and understand complex issues. I really like the way you explain each concept with details on how the same is derived and then also depict them graphically. Thanks for putting so much effort in creating these online lessons. Your videos are so true and representative of the channel name : statisticsfun Kind Regards, Deepti
will you add a series of videos using your verify through style on how to write the results from the stats tables into SPSS. It would take this channel to another level and help my students. You are dynamic!
God bless You! If possible, please organize your video and knowledge in playlists in such a way that it can be a credit course for stats. My professors were confusing, but this is amazing. Thanks a ton!
Darshan Patel Great idea. I have created some playlists on my channel. Unfortunately UA-cam really limits navigation! Someday I want to build my own website for my content where I can control user-ability. Good luck in your classes.
thank u so much u have helped me doing my thesis. Imagine a geophysic major doing a thesis that needs to do statistics which i have no idea at all about statistic
I watched your linear regression video two years ago for my degree final project, now I am watching your multiple regression video for my master final project, and i still don't feel fun in statistics. :(( but thank you they are really helpful :D
thank you very much for your presentation, its really make statistics fun. just I have one comment about the plotting of dependent variable and the independent variables when you plotted the sum of squares , I think the dependent variable should be in the y axis and the independent variable (the explanatory variables) should be in the x axis.
+Jennifer Broadwell You are very welcome. If you get a chance like and share the videos (also like MyBookSucks FB page www.FaceBook.Com/partymorestudyless)
At time 3:28 you say you showed us how to get the estimated grades in the first video. I don't think you did. I checked and can not find it. You did show the regression equation. How does that give you the estimated grades?
Sebastian Streeting Make sure you share the love, If you get a chance make sure you like and share the videos, it will make it easy for others to find them.
uhm at first you say grades are your dependent value then in the graph you refer to them as independent and the graph has dependent on the x axis and independent on the y axis
No offence the job that you are doing is great but these are not videos on how to read the tables is how to calculate ( get the numbers on the table) !thank you for wasting my TIME! :)


wow, finally someone who explains visually!! Visuals are the only thing that help me understand concepts. Please keep doing thiss!!
your videos are AMAZING. I tried all weekend to understand this material and I couldn't. But after watching your videos everything is clear now. I thank you a lot. You are a genius
That is great to hear! Hope you did well on your final too. I do have channels on Economics, Calculus and Algebra too. You can see links to these on the MyBookSucks Facebook Page (see link in video description).
Yes you are correct! Good catch, I will revise those graphs. I have it labeled incorrectly. Grades are the dependent variable because they "depend" on absences and SAT score. I mention that right in the first part of the video.
Hi, I really like how you explain and your voice is so relaxing. The videos are simple and easy to understand! :) Great job!
I must appreciate for your exceptional explanation techniques. Thanks a lot David Sir..
First I want to thank you for your helpful tutorials. Its really nice how you explain the statistics involved, but why don't explain the interpretation as well. Like what F-score really mean and what significance stand for. It will help a lot in applications of statistics like Hypotheses testing.
Oh and what kind of software you used for your presentation ? :)
I have to agree. Thank you for your clear explanation with very good visuals. (It's even helpful that your voice is pleasing in tone!)
thank you sooooooooooooooooooooooooooooooooooooooooooooooooooooooooooo much mr. David it was very helpful for me thank you sir
+khalid talib You are very welcome. Hopefully you will get a chance to like and share the videos. This will help other students find them.
Many thanks for your kind words. I don't have any videos on heteroskedasticity and autocorrelation yet.
Thank you for these videos. Having an exam in this on Monday, and these really help! :)
Hello Prof. Longstreet,
Thanks heaps for uploading the videos.
Your videos are incredible to learn stats and understand complex issues. I really like the way you explain each concept with details on how the same is derived and then also depict them graphically. Thanks for putting so much effort in creating these online lessons. Your videos are so true and representative of the channel name : statisticsfun
Kind Regards,
Deepti
will you add a series of videos using your verify through style on how to write the results from the stats tables into SPSS. It would take this channel to another level and help my students. You are dynamic!
God bless You! If possible, please organize your video and knowledge in playlists in such a way that it can be a credit course for stats. My professors were confusing, but this is amazing. Thanks a ton!
Darshan Patel Great idea. I have created some playlists on my channel. Unfortunately UA-cam really limits navigation! Someday I want to build my own website for my content where I can control user-ability. Good luck in your classes.
Thank you! I hope, for the idea i can have full access to the content on your website. I will need it in future too.
Superb - Mind blowing - It is more than excellent.
thank u so much u have helped me doing my thesis. Imagine a geophysic major doing a thesis that needs to do statistics which i have no idea at all about statistic
You are very welcome! Make sure you like MyBookSucks on FaceBook (see link in video description). This will help others find the educational videos.
Best explanation ever! I really enjoyed it, thanks so much!
I watched your linear regression video two years ago for my degree final project, now I am watching your multiple regression video for my master final project, and i still don't feel fun in statistics. :(( but thank you they are really helpful :D
you are an amazing teacher
I actually drew the graphs with Adobe Illustrator just to illustrate what regression is all about.
thank you very much for your presentation, its really make statistics fun. just I have one comment about the plotting of dependent variable and the independent variables when you plotted the sum of squares , I think the dependent variable should be in the y axis and the independent variable (the explanatory variables) should be in the x axis.
This is very helpful. thank you so much for posting this!
+Jennifer Broadwell You are very welcome. If you get a chance like and share the videos (also like MyBookSucks FB page www.FaceBook.Com/partymorestudyless)
Awesome videos, really down to earth and very carefully explained thanks a lot! Do you have any videos on heteroskedasticity and autocorrelation?
Thank you very much Sir... This is so helpful for my thesis.
Sumudu Dias Great to hear and good luck on your thesis. Just curious, what is the topic of your thesis?
thanx fr d video...it is very helpful...
How did you get this to graph? What information did you use? Did you graph in SPSS?
Thank you very much. it was really helpful for me. I think the title of axis should be modified. Grade is dependent variable.
thank you sir plz share the intrepretatiion as well
At time 3:28 you say you showed us how to get the estimated grades in the first video. I don't think you did. I checked and can not find it. You did show the regression equation. How does that give you the estimated grades?
Isn't the grade should be dependent variable?
LEGEND, thank you so much!
Sebastian Streeting Make sure you share the love, If you get a chance make sure you like and share the videos, it will make it easy for others to find them.
THANK YOU
hi I can not find fist video please provide the link, thanks
Brlliant!
uhm at first you say grades are your dependent value then in the graph you refer to them as independent and the graph has dependent on the x axis and independent on the y axis
The regression i add all together is 2079, but the SPSS calculate is 2105. Why ?
I just checked, and it's of the way he rounds his numbers. Here's the same table without any rounding:
i.imgur.com/kv0tLQl.png
Thanks
I thought Grades was your dependent variable?
Never mind, I found it in the second video.
Is anyone still watching this
No offence the job that you are doing is great but these are not videos on how to read the tables is how to calculate ( get the numbers on the table) !thank you for wasting my TIME! :)