Visualising the Fourier Transform

Вставка
- Опубліковано 12 вер 2024
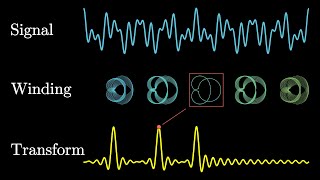
- Intuitive example of how the Fourier Transform relates time domain signals to their frequency domain representation.
* I should have mentioned that the definition of the Fourier transform of periodic signals includes a factor of 2pi. So the amplitude of the bottom graph is 2pi times the coefficient of the respective cos wave. For example, the "zero frequency" (DC offset) component of 1/2, is indicated on the bottom graph by the amplitude 2pi x 1/2 = pi = 3.14159...
Check out my search for signals in everyday life, by following my social media feeds:
Facebook: www.facebook.c...
Instagram: / iainexplains
Related videos: (see www.iaincolling...)
• What is the Fourier Transform? • What is the Fourier Tr...
• What is the Fourier Transform used for? • What is the Fourier Tr...
• Fourier Transform Equation Explained • Fourier Transform Equa...
• Why are Sinc and Square a Fourier Transform Pair? • Why are Sinc and Squar...
• Typical Exam Question on Fourier Transform Properties • Typical Exam Question ...
• Discrete Time Basis Functions • Discrete Time Basis Fu...
• How does the Discrete Fourier Transform DFT relate to Real Frequencies? • How does the Discrete ...
• Laplace Transform Equation Explained • Laplace Transform Equa...
• Laplace Transform Region of Convergence Explained • Laplace Transform Regi...
• What is the Z Transform? • What is the Z Transform?
• Z Transform Region of Convergence Explained • Z Transform Region of ...
• Is Phase important in the Fourier Transform? • Is Phase important in ...
For a full list of Videos and accompanying Summary Sheets, see the associated website: www.iaincolling...


I remember learning Fourier Transform when I was a bachelor student. I loved it. Plain and simple. I could have never imagined one could compose different frequencies of a trigonometric function and build any signal. Thanks for sharing this visualization.
Yes, it's not intuitive, but it's amazing, like you say! Glad you liked the video.
This made it click for me why the Fourier transform of a rectangular pulse is a sinc function. Loving this channel so far!
Here's a video specifically on that topic: "Why are Sinc and Square a Fourier Transform Pair?" ua-cam.com/video/ZcTWLwXGql0/v-deo.html
Once again the legend delivers a classic. Cheers mate.
Nice one. I'm glad you liked it.
Thanks a lot professor!Your videos are masterpieces and they really helped me!
I'm so glad to hear that!
Very helpful visualization. Thanks again Iain!
Glad you found it useful.
Fantastic! Would it be possible to do a similar video that helps visualize how phase plays into things?
This video might help: "Is Phase important in the Fourier Transform?" ua-cam.com/video/WyFO6yBQ0Cg/v-deo.html
Hey Iain! I just was wondering what the y-axis of the frequency graph was? To me that is the amplitude, but i dont understand how it effects the graph, why is the 0Hz midline .5 instead of 0? Cheers!
Yes, it's amplitude. I forgot to say that there is a 2pi factor in the Fourier transform. So the amplitude of the "zero frequency" spike in the frequency domain graph is 0.5 times 2pi = 3.14159...
@@iain_explainsI had the same question, thanks for the response! How does the frequency amplitude affect its respective sinusoid in the time domain?
Well, each "frequency amplitude" corresponds to a single sinusoidal waveform (in the time domain) at that particular frequency. So the amplitude shown in the frequency domain (scaled by 2pi) is the amplitude of that corresponding sinusoid in the time domain (as I showed in the video when I plotted each sinusoid separately) .
Thanks professor!
Maybe it would be also interesting to see the pulse non-periodic rect signals vs. their FT, for example wide rect x(t) signal becomes narrow X(t), and narrow x(t) becomes wide X(t).
Here's a video on this: "Why are Sinc and Square a Fourier Transform Pair?" ua-cam.com/video/ZcTWLwXGql0/v-deo.html
Love your videos, they been a great resource in my communications class. Are you able to share the code used in this video?
The code is available on my website, under the Signals and Systems tab, in the Fourier Transform section iaincollings.com
Sir, I have a question that is not relevant to the video but anyways I am asking it here so please accept my apologies if I am asking irrelevant questions.
Well the question is about intermediate frequency.
Can you explain how frequency is translated from RF to IF without disturbing its components. For instance, I am a GNSS student and I know GPS signal contains code, carrier and data. Now if we take IF, how is the code and data still preserved within the carrier
Also how to determine the amount of IF we need I mean does it depends on our hardware equipment requirement or there are any specific rules for IF translation. I am studying a Book where GPS 1575.42 MHz is converted into a 9.8 MHz IF.
In the given graph, avg value of the square wave (DC) is 0.5 right ?
But in the spectrum at zero frequency (DC) it shows amplitude 3.
Why ? Pls explain if my concept is wrong....
In the description below the video it says: "* I should have mentioned that the definition of the Fourier transform of periodic signals includes a factor of 2pi. So the amplitude of the bottom graph is 2pi times the coefficient of the respective cos wave. For example, the "zero frequency" (DC offset) component of 1/2, is indicated on the bottom graph by the amplitude 2pi x 1/2 = pi = 3.14159..."
Thank you very much sir for ur clarification.
But why this multiplication required?
That also wil u pls explain ?
The 2pi comes about due to the fact that omega (in radians) equals 2pi f (in Hertz).
Thank you so much if it possible to explain the orthogonality in matlab like this thank you so much
Thanks for the suggestion. I'll add it to my "to do" list. In the meantime, you might like this video: "Orthogonal Basis Functions in the Fourier Transform" ua-cam.com/video/n2kesLcPY7o/v-deo.html
hello, Iain, would you be like make some video for laplace, fourier and zeta transform please, i think that will help more people to understand
Hopefully this is what you're looking for: "How do Poles and Zeros affect the Laplace Transform and the Fourier Transform?" ua-cam.com/video/iP4fckfDNK8/v-deo.html
But at 0Hz [1:15] , it is shown as 3v at transformed waveform..
is that possible to be the normalized data?
It’s not actually 3V, it’s 3.14159… ie. pi. Which is half of 2pi.
👍