WWDC24: Run, Break, Inspect: Explore effective debugging in LLDB | Apple

Вставка
- Опубліковано 29 вер 2024
- Learn how to use LLDB to explore and debug codebases. We'll show you how to make the most of crashlogs and backtraces, and how to supercharge breakpoints with actions and complex stop conditions. We'll also explore how the "p" command and the latest features in Swift 6 can enhance your debugging experience.
Discuss this video on the Apple Developer Forums:
developer.appl...
Explore related documentation, sample code, and more:
The LLDB debugger: lldb.llvm.org/
Symbolication: Beyond the basics: developer.appl...
Debug with structured logging: developer.appl...
00:00 - Introduction
00:42 - Agenda
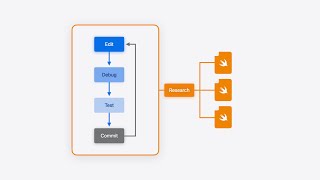
01:15 - Debugging as a search problem
04:07 - Crashlogs & starting the program
07:27 - Breakpoints
12:10 - Breakpoint actions
15:27 - Help command
16:05 - High-firing breakpoints
19:24 - The p command
25:39 - @DebugDescription macro
27:50 - Wrap-up
More Apple Developer resources:
Video sessions: apple.co/Video...
Documentation: apple.co/Devel...
Forums: apple.co/Devel...
App: apple.co/Devel...