Using Excel for a Calibration Curve | How To Create A Linear Standard Curve In Excel

Вставка
- Опубліковано 23 січ 2024
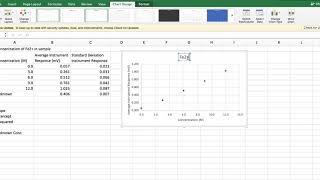
- In this video, you will learn about Using Excel for a Calibration Curve and how to Generate a Standard Curve and determine Unknown Concentrations in Excel by a Simple Method. A standard curve is used to accurately determine the concentration of your sample from the signal generated by an assay. I will show you how to create a standard linear curve using Microsoft Excel and how to use it to calculate unknown sample values. Additionally, you will also learn how to draw calibration curve in excel. A calibration curve is a way to identify the concentration of an unknown substance. These curves use data points of known substances at varying concentrations, and researchers or developers can use these curves to find where an unknown substance plots. I will use imaginary data of concentration and absorbance as an example and will generate calibration curve using this data. I have used excel 365 to generate a standard curve and calibration curve and determine an unknown concentration of compound. You can also use other versions of excel such as excel 2013, excel 2019 and excel 2016.
#calibrationcurve #teachingjunction #excel #concentrationvsabsorbance #calibrationcurveexcel
Watch other UA-cam video tutorials on Excel:
Generating Standard Curve and Determining Concentration of Unknown Sample in Excel: • Generating Standard Cu...
Plot Multiple Lines in Excel: • Plot Multiple Lines in...
How To Plot Multiple Data Sets on the Same Chart in Excel: • How To Plot Multiple D...
How to change vertical Axis Values in Excel (Line chart): • How to Change the Vert...
Other UA-cam queries:
Using Excel for a Calibration Curve,
How to Make a Calibration Curve in Excel,
How To Create A Linear Standard Curve In Excel,
calibration curve in excel,
calibration curve excel,
How To Draw Calibration Curve,
Absorbance vs concentration,
How To Create A Linear Standard Curve In Excel,
Generating Standard Curve and Determining Concentration of Unknown Sample in Excel - Simple Method,
How to calculate Protein Concentration of Unknown Sample from standard curve in excel,
Generating Standard Curve and Determining Unknown Concentration in Excel,
Plot concentration vs absorbance scatter plot,
Calculate the concentration of the unknown sample from the absorbance measurement of an unknown sample,
Add Trendline,
Using Excel for a Calibration Curve,
How To Create A Linear Standard Curve In Excel,
how to create a linear standard curve in excel,
standard curve in excel,
how to make standard curve in excel,
how to create a standard curve in excel,
how to make a standard curve in excel,
standard curve excel,
standard curve absorbance vs concentration,
standard curve,
standard normal curve,
standard addition calibration curve,
how to plot standard curve,
unknown concentration from standard curve,
how to make standard curve in excel,
gallic acid standard curve preparation,
how to draw standard curve,
Creating a Line of Best Fit on Excel,
Using Excel - Creating a Scatter Plot and Line of Best Fit,