Principal Component Analysis (PCA) 1 [Python]

Вставка
- Опубліковано 5 лют 2020
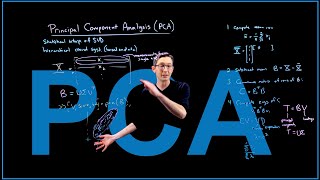
- This video describes how the singular value decomposition (SVD) can be used for principal component analysis (PCA) in Python (part 1).
Book Website: databookuw.com
Book PDF: databookuw.com/databook.pdf
These lectures follow Chapter 1 from: "Data-Driven Science and Engineering: Machine Learning, Dynamical Systems, and Control" by Brunton and Kutz
Amazon: www.amazon.com/Data-Driven-Sc...
Brunton Website: eigensteve.com
This video was produced at the University of Washington - Наука та технологія
![Principal Component Analysis (PCA) 2 [Python]](http://i.ytimg.com/vi/fu7uXxZMzC8/mqdefault.jpg)
![Principal Component Analysis (PCA) 2 [Python]](/img/tr.png)


![SVD: Eigenfaces 1 [Python]](/img/n.gif)
Thank you so much for providing all of this knowledge online for free !
A brilliant set of videos. Thank you so much.
The code cuts off at the edge of the video. Where can we download it. Thanks for sharing this!
Beautiful code!
Great lecture Steve!
You explained that "u" in svd represents principal direction, "sigma" represents loading. What does "v" represents ?
There’s a whole series a lectures explaining this (and a book.
You said in the video that each row of X will represent an example/or record, and column will represent the feature. In your code, X.shape = (2, 1000) where each column represent one data point and. B is passed to the SVD with same shape. Hence the VT matrix size is (2,1000) which means that there are 1000 principle Componenets, that is not possible of 2D data??? Am I right or wrong?? Please explain?
excellent video!!! Thks
You are welcome!
Hi Mr. Steve,
I have one question, why are you dividing the "B by np.sqrt(nPoints)"
U, S, VT = np.linalg.svd(B/np.sqrt(nPoints),full_matrices=0)
dividing mean centered data by sqrt of no.of data -?? Could not understand.
Actually i have the exact same question. Could you figure it out?
@@melvinlara6151 I didn't see the whole lecture yet, but I guess B is data with mean =0 and np.sqrt(nPoints) probably is the standard deviation (variance squared). So he first standardize the data then he applies SVD ...
@@JoaoVitorBRgomes hey! actually i figured the same thing out. But, thank you;
@@melvinlara6151 no problem Melvin Lara, I am a student of Data Science too. If you have a kaggle profile and want to exchange knowledge my alias is " topapa .
In PCA literature, the covarience matrix (B*)B is normalized by nPoints (or the bessel correction (nPoints -1), but doesn't matter here because nPoints is large). So if you normalize B by np.sqrt(nPoints) instead, B* also gets normalized by np.sqrt(nPoints) and you end up getting the (B*)B normalized by nPoints
Why the division in B/np.sqrt(nPoints)?
In PCA literature, the covarience matrix B*B is normalized by nPoints (or the bessel correction (nPoints -1), but doesn't matter here because nPoints is large). So if you normalize B by np.sqrt(nPoints) instead, B* also gets normalized by np.sqrt(nPoints) and you end up getting the C normalized by nPoints
where C = (B*)B, & B* is the transpose of B
I tried to download the code from the website, but Python code folder includes only Matlab code :(
Hi, it was corrected - I downloaded it today !
i kneel............................................................
I would prefer to do this in my head because I can visualize it and move it around. I am not a mathematician but many of these are terms for things I am already familiar with. Perhaps I should have kept my TRS80 and took Bill's Class at Juanita High. I decided to concentrate on 'Salmon Enhancement' and 'European History' instead. It's probably just as well, I find writing code quite boring because I am more into Concepts... "Keep up the Good work!"
Math is fully about concepts. And how would you visualize something that is higher than 3 dimension?
@@saitaro Extrapolation
add a time term? or 4dimension more is exist just at theorical expression
this technique is generally used when large amounts of higher dimensional data are there. like in image processing
for example if u take 50(50*50) images it will become 50,2500 dimensional data resulting in covariance of 2500*2500
matrix where pca is used to extract eigen faces.
now i don't think there are people who can solve eigen value equation for 2500 * 2500 matrix in head
@@yaseenmohammad9600 Maybe if the variables are 'round' enough I could 'take a shot' at it...