This is terrifying omg. You approach it soooooo perfectly and all the math behind just guide me to the point that I have to say WOW! Such a good observation, this video is by far golddd. I love your approach at 22:56 so much, you guide me to that point and say, that's the regulization term and I was omg wtf is happening, that's what I was trying to understand all this time and this guy, you, just explain it in a few minutes. Really appreciate
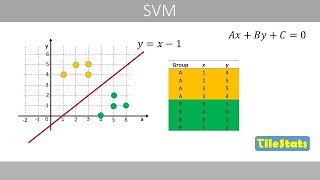
Great tutorial. (16:23) "if point is blue, and ap + bq + c > 0", I think the equation should have BLUE color (to indicate the BLUE dash on the graph) rather than RED. Similarly, "if point is red, and ap + bp + c < 0", the equation should be RED (to indicate the RED dash on the graph) instead of BLUE. Pardon me if I am wrong.
Luis, tus vídeos son simplemente maravillosos! Pienzo cuanto conociemiento e claridad fue necesário. Quote by Dejan Stojanovic: “The most complicated skill is to be simple.”
This is a great explanation of the concepts, it helped me. But isn't this video about the Support Vector Classifier and not the SVM (which uses kernelization)? The SVC uses the maximal margin classifier, with a budget parameter for errors, and the SVM uses the SVC in an expanded feature space made by kernelization.
Thank you very much for this video. As usual you are so good in explaining the complex things in simple way. First time I am able to understand the motive behind SVC and also how it is different from Logistic regression. Can you please make a video on SVM kernels (Polynomial, Gaussian, Radial ...)
Hi Luis, Thanks very much for these videos. I watch them with great pleasure. I have some questions though about this one. The questions are preceded by the moment in the video (in mm:ss) where I have my question. 14:26: For determining whether a point is correctly classified, should you compare the red points to the red (dashed) line and the blue points to blue (dashed) line? Or should we compare all points to the black line? I assume it is the first although this is not mentioned explicitly. 22:07: The margin is different when you start with a different value of d in ax+by+c=d. Would you always start with d=1 and -1 or are there situations you start with other values of d (see also my question below)? 27:33: Two questions here. 1) In the second example the margin is actually not increased but decreased. Your video however only talks about expansion, not the opposite. How does reduction of the margin happen? Or does this only work by starting the algorithm with a smaller expansion so with a smaller value of d than 1 in ax+by+c=d? 2) It seems to me that the first solution will also be the result of minimizing the log-loss function as this maximizes the probabilities that a point is classified correctly. So the further the points are away from the line in the correct area, the better it is. And that seems to be the case for the first solution. So what is the difference between this log-loss approach and the SVM approach? Do they deliver different results? If so, when would you choose the one or the other? Thanks, Frank
Hey Louis, I have recently come across your videos and I am blown away by your simplistic approach to delivering the mathematics and logic especially the mention of the applications. A quick one, DO YOU TAKE STUDENTS, I WOULD LIKE TO ENROLL. I have more interest in analysis of biological data and o rarely find as much good video as this. I'm simply in love with your methods !!!!!
I think that you are right; I don´t know anythong about SVM (wich is why I ended up here), but I was thinking during the entrie video that it doesn´t make sense to create parallel lines if there are not used.
Thank you for the good explanation. However, I miss some introductions. What is its added value compared to Logistic Regression? And some recommendations on when to prioritize this algorithm against other...
In the pseudo algorithm of svm, in the last step we multiply a,b,c by 0.99 then even the right hand side should be multiplied by 0.99 making the right hand side to 0.99 and not 1. Am I missing something?
As always excellent and easy to understandable vedio.
4 роки тому
So if data is separable with a large margin, the margin error is small... even though the model produces worse classification than the model with a small margin having a high margin error. is that correct?
Can I ask that step of separating line is just only for optimizing the model, right? Like in the case when you have 2 lines have already separated the training data, so you expand the line to see how wide they are?
can someone explain why the margins don't keep diverging infinitely? the final step of the SVM algorithm involves multiplying a, b and c by 0.99. If you keep doing that don't you just get lines that are infinitely far apart? thank you
Hi Luis, amazing job. But just one question. Could there be a typo on the criteria for misclassification of points?. I mean, I think the criteria should be: for blue: ap+bq+c>-1, and for red: ap+bq+c
Thank you very much for this amazing video. I have come across your channel only recently and I do like your way of explaining these complicated topics. I have got two (hopefully not too dumb) questions regarding SVMs: Given the similarity of SVMs and logistic regression, would it be a good idea to start from an LR-result instead of a random line? Did I understand correctly, that the distance between the two lines can only increase during the search for the best solution? Wouldn't it be conceivable that at some point the combined error function decreases by decreasing the distance between the lines?
Thank you, great questions! 1. That's a good idea, it's always good to start from an good position rather than a random one. Since the two algorithms are of similar speed (complexity), I'm not sure if starting from LR is necessarily better than just doing an SVM from the start, but it's definitely worth a try. 2. Actually, in the process of moving the line, one could change the coefficients in such a way that the lines get a little closer again (for example, if a and b are both increased in magnitude, the lines get close together).
In my opinion, suggestion that every iteration margin is increasing, is misleading. If I understood it correctly, margin error is truly making it bigger but there is also classification error which can easily compensate this and overall make margin decrease in a single iteration.
logistic regression doesn't have the concept of margin maximization, There exist infinite hyperplane that separates the data, but how would you choose a good one? SVM comes into rescue (it generalize well). Also, SVM is not so popular just because It finds the best hyperplane, KERNEL TRICK " dual form of SVM" (taking data to higher dimension without much computation cost (KERNEL FUNCION) and making it linearly separable, imagine two concentric circles dataset) is what made SVM so popular, which logistic regression could not achieve.
It takes a bit of calculations, but here's a place where it's done: www.ck12.org/geometry/Distance-Between-Parallel-Lines/lesson/Distance-Between-Parallel-Lines-GEOM/


Just want to leave a comment so that more people could learn from your amazing videos! Many thanks for the wonderful and fun creation!!!
The best Machine learning / Deep learning I've learnt from.
This is the best SVM explanation! I never truly understand it until I watch your video!
This video should go viral.... So that ppl benefit from it.... Great teaching
Mr. Serano, U r the only 1, who explains the logic of ML and not the technicalities. Thank U
As always, very nicely and easily explained. Looking forward to seeing your explanation about PCA, TSNE and some topics of Reinforcement Learning.
Best explanation of SVM on UA-cam. Keep up the good work.
Visual, thorough, informal - perfect!
This is terrifying omg. You approach it soooooo perfectly and all the math behind just guide me to the point that I have to say WOW! Such a good observation, this video is by far golddd. I love your approach at 22:56 so much, you guide me to that point and say, that's the regulization term and I was omg wtf is happening, that's what I was trying to understand all this time and this guy, you, just explain it in a few minutes. Really appreciate
Amazing explanation Luis! As usual. You are a great professor making complex topics in very simple explanations.
The best SVM explanation I ve listened to. Thank you.
You made the SVMs look like a walk in the park. Thoroughly enjoyed this as I enjoyed your Math for ML specialisation in CoursEra.
Pure genius.
It really takes a genius to explain these things with such extreme simplicity.
I really like your accent, could listen all day. Living legend Luis
Thank you, this is fantastic! Your visual explanations are great, they’ve really helped understand the intuition of these techniques.
Super explanation Luis!
It great when someone can bring out the intuitions and meaning behind mathematics in such a clear way!
very succinct way of explaining hyperparameter of eta and c. normally I just take things for granted and just do hyperparameter tuning
BEST explanation of SVM so far!
The best explanation of SVM I have ever seen
Great tutorial. (16:23) "if point is blue, and ap + bq + c > 0", I think the equation should have BLUE color (to indicate the BLUE dash on the graph) rather than RED. Similarly, "if point is red, and ap + bp + c < 0", the equation should be RED (to indicate the RED dash on the graph) instead of BLUE. Pardon me if I am wrong.
I am way too late here...but so happy to have found a gold mine of information! Amazing explanation!!
Luis, tus vídeos son simplemente maravillosos! Pienzo cuanto conociemiento e claridad fue necesário. Quote by Dejan Stojanovic: “The most complicated skill is to be simple.”
the more you speak the better it gets, please keep giving practical examples of applications at the end of each video
16:36, Multiply a,b,c by 0.99, so in the loop, 0.99ap+0.99bq+0.99c is the same with ap+bq+c, so is 0.99 multiply senseless?
Sir, thank you for the video, extremely well explained in short duration. Really appreciable
This is a great explanation of the concepts, it helped me.
But isn't this video about the Support Vector Classifier and not the SVM (which uses kernelization)?
The SVC uses the maximal margin classifier, with a budget parameter for errors, and the SVM uses the SVC in an expanded feature space made by kernelization.
Very nice explanations.. May your channel flourish !!
Legend. Keep doing what you do!
Simply awesome...even thank you is not enough to describe how well this video is....explained thoughest things in kids language
Best explanation! You got some skills to teach hard things in an easy way.
Nice Sir, best teaching style.
Love the way you teach...
Thank you very much for this video. As usual you are so good in explaining the complex things in simple way. First time I am able to understand the motive behind SVC and also how it is different from Logistic regression. Can you please make a video on SVM kernels (Polynomial, Gaussian, Radial ...)
Very insightful lecture. Thank you very much Dr Serrano.
Hats off to you,sir. Very clear with the concept
A very nice explanation of SVM I have ever read.
Mate you're a great teacher
best svm explanation. Thanks a lot!
Hi Luis, Thanks very much for these videos. I watch them with great pleasure. I have some questions though about this one. The questions are preceded by the moment in the video (in mm:ss) where I have my question.
14:26: For determining whether a point is correctly classified, should you compare the red points to the red (dashed) line and the blue points to blue (dashed) line? Or should we compare all points to the black line? I assume it is the first although this is not mentioned explicitly.
22:07: The margin is different when you start with a different value of d in ax+by+c=d. Would you always start with d=1 and -1 or are there situations you start with other values of d (see also my question below)?
27:33: Two questions here. 1) In the second example the margin is actually not increased but decreased. Your video however only talks about expansion, not the opposite. How does reduction of the margin happen? Or does this only work by starting the algorithm with a smaller expansion so with a smaller value of d than 1 in ax+by+c=d? 2) It seems to me that the first solution will also be the result of minimizing the log-loss function as this maximizes the probabilities that a point is classified correctly. So the further the points are away from the line in the correct area, the better it is. And that seems to be the case for the first solution. So what is the difference between this log-loss approach and the SVM approach? Do they deliver different results? If so, when would you choose the one or the other?
Thanks, Frank
Thanks for your easy and understandable explanation
You made complex topic very easily understandable 👍👍
HOLY SHIT, BEST EXPLANATION EVER
Hey Louis, I have recently come across your videos and I am blown away by your simplistic approach to delivering the mathematics and logic especially the mention of the applications. A quick one, DO YOU TAKE STUDENTS, I WOULD LIKE TO ENROLL. I have more interest in analysis of biological data and o rarely find as much good video as this. I'm simply in love with your methods !!!!!
A very good explanation comparing to other available in the Internet
Thank you for this simplifying the concepts! I enjoyed watching this video!
Thank you for your work Luis!
I think SVM's loop should use one line ap+bq+c-1>0 for blue points and another line ap+bq+c+1
I think that you are right; I don´t know anythong about SVM (wich is why I ended up here), but I was thinking during the entrie video that it doesn´t make sense to create parallel lines if there are not used.
Efficient, effective and fun. Thanks very much
Thank you for the good explanation. However, I miss some introductions. What is its added value compared to Logistic Regression? And some recommendations on when to prioritize this algorithm against other...
In the pseudo algorithm of svm, in the last step we multiply a,b,c by 0.99 then even the right hand side should be multiplied by 0.99 making the right hand side to 0.99 and not 1. Am I missing something?
You are the best Luis.
Awesome.. I liked your videos so much that I bought your book and the book is great too.
Thank you Krishna, so glad to hear you liked it! ;)
Thanks Luis, SVM makes much sense now :)
Thanks!
Muchas gracias de nuevo @PedroTrujillo! :)
You are an Awesome Teacher. Love you :)
As always excellent and easy to understandable vedio.
So if data is separable with a large margin, the margin error is small... even though the model produces worse classification than the model with a small margin having a high margin error. is that correct?
Thank you very much for that hard work. it was so informative and well described.
I love this so much! Explain in a ver friendly way!
in the loop, when do you use the parallel lines?ax+by+c=1 and ax+ bx+c=-1
Really good explanation! thank you sir.
Hello,
When we multiply the equation by the expanding rate of 0.99, should the right side of the equal be 0.99, 0, and -0.99? Thanks.
Explained very simple. Thanks a lot.
Can I ask that step of separating line is just only for optimizing the model, right? Like in the case when you have 2 lines have already separated the training data, so you expand the line to see how wide they are?
Thanks for your easy and understandable explanation:)
And at step 5, I think after add/subtract 0.01, you should also have to do gradient descent, right?
Thanks a lot for such a nice explanation.
How to generalize these algorithms to many dimensions? My problem has about 50 atributes instead of 2, and I need to classify data as "red or blue"
Would be grateful if you can have explanations on Gaussian Process and hyperparameters optimisation techniques.
Great Lecture! You need to make a video on how to perform all these algorithms with Scikit-learn package in python
can someone explain why the margins don't keep diverging infinitely? the final step of the SVM algorithm involves multiplying a, b and c by 0.99. If you keep doing that don't you just get lines that are infinitely far apart? thank you
Hi Luis,explaination is great no doubt but the equations that u wrote for margin error should be ax+by=1 and ax+by=-1
Hi Luis, amazing job. But just one question. Could there be a typo on the criteria for misclassification of points?. I mean, I think the criteria should be: for blue: ap+bq+c>-1, and for red: ap+bq+c
Thank you very much for this amazing video. I have come across your channel only recently and I do like your way of explaining these complicated topics.
I have got two (hopefully not too dumb) questions regarding SVMs:
Given the similarity of SVMs and logistic regression, would it be a good idea to start from an LR-result instead of a random line?
Did I understand correctly, that the distance between the two lines can only increase during the search for the best solution? Wouldn't it be conceivable that at some point the combined error function decreases by decreasing the distance between the lines?
Thank you, great questions!
1. That's a good idea, it's always good to start from an good position rather than a random one. Since the two algorithms are of similar speed (complexity), I'm not sure if starting from LR is necessarily better than just doing an SVM from the start, but it's definitely worth a try.
2. Actually, in the process of moving the line, one could change the coefficients in such a way that the lines get a little closer again (for example, if a and b are both increased in magnitude, the lines get close together).
thank you for the good explanation.
Great explanation
what a explanation . Dammn good . you r great sir
please make some video on Xgboost and other algorithm also
What is the name of the algorithm you have introduced in the lecture?
as always well explained.
Thank You for this video ❤️
SVM is constrained optimization so it needs Lagrange Multiplier?
Hello Sir, Do we have video on feature selection ?
Hi sir..why parallel lines equated to +1 and -1?
very well explained. thanks mate :-)
awesome explanation
Thank you very much for this video.
sir also teach the kernal method of it in deepth .
Great work!
Awesome video. Can you do more videos about LLMs?
Thanks for the suggestion! I did some recently, here they are: ua-cam.com/play/PLs8w1Cdi-zva4fwKkl9EK13siFvL9Wewf.html
Thanks Luis, great video and explanation! How do you do the animation in the video?
In my opinion, suggestion that every iteration margin is increasing, is misleading. If I understood it correctly, margin error is truly making it bigger but there is also classification error which can easily compensate this and overall make margin decrease in a single iteration.
Thank you for that video!
Hi Luis, I like your youtube video animations, they are great! Can I know what software you use for animations?
SVM is only for separating the points of two classes only?!
Great video!!!
I dont really understand why we would use SVMs vs logistic regression. both are used to find the perfect fitting line.
logistic regression doesn't have the concept of margin maximization, There exist infinite hyperplane that separates the data, but how would you choose a good one? SVM comes into rescue (it generalize well). Also, SVM is not so popular just because It finds the best hyperplane, KERNEL TRICK " dual form of SVM" (taking data to higher dimension without much computation cost (KERNEL FUNCION) and making it linearly separable, imagine two concentric circles dataset) is what made SVM so popular, which logistic regression could not achieve.
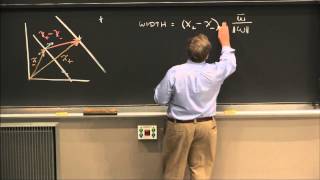
22:00 can anyone derive that expression?
It takes a bit of calculations, but here's a place where it's done: www.ck12.org/geometry/Distance-Between-Parallel-Lines/lesson/Distance-Between-Parallel-Lines-GEOM/
The "Margin Error" part is confusing. Didn't get it.
Plz anyone tell me... how 1 n -1 came in equation of line..
Great videos!
Superb!