Thank you! You forgot to mention the Transpose[] function though. Let's say you have two lists, datax = { x1, x2, x3, x4, x5, ... } and datay = { y1, y2, y3, y4, y5, ...} Then you can combine them to pair using Transpose[{ datax, datay }]. The same works for x, y, z, w and so on.
Thank you :) Can you do a presentation for using the levenberg marquardt algorithm for minimizing the difference of squares between experimental and theoretical data? Im having issues with the syntax. Thanks!
Is there anyway that we can create a fit range? In other words is there a way that we can fit within a certain range. The further I get away from my source then lower the signal-to-noise and I don't want to fit that part. Thanks.
Hi, How can I find a regression for a nonlinear model? Say I have an experimental data, and 2 curve fits, and I obtained one of them with Mathematica, How can I compare the 2 equations to see which one is closer to my data? I mean which one has least square or least deviation from experimental data?


Very useful tutorial! Absolutely beneficial towards some experimental data fitting I needed to conduct.
I know its an old post, but it just helped me, thanks :)
Love your presentation style:very concise and efficient !!
Fantastic! Keep on helping us! Thanks
Thank you! You forgot to mention the Transpose[] function though. Let's say you have two lists, datax = { x1, x2, x3, x4, x5, ... } and datay = { y1, y2, y3, y4, y5, ...}
Then you can combine them to pair using Transpose[{ datax, datay }]. The same works for x, y, z, w and so on.
+Markus
Thanks. I was using clumsier Table[{datax[[i]],datay[[i]]},{i,N}]
How would I remove the e from the fitted function into the form- y=ab^(k-t)?
Thank you, super useful!
Thank you :) Can you do a presentation for using the levenberg marquardt algorithm for minimizing the difference of squares between experimental and theoretical data? Im having issues with the syntax. Thanks!
Is there anyway that we can create a fit range? In other words is there a way that we can fit within a certain range. The further I get away from my source then lower the signal-to-noise and I don't want to fit that part. Thanks.
Hi, How can I find a regression for a nonlinear model?
Say I have an experimental data, and 2 curve fits, and I obtained one of them with Mathematica, How can I compare the 2 equations to see which one is closer to my data? I mean which one has least square or least deviation from experimental data?
How can I get dimensional image for log(y)=-0.246963*log(x1)+11.54065*log(x2)-119.6620 regression model
Please help me :(
Guaranteed is the correct spelling this was not how you had it on your video.
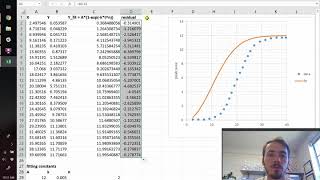
blurry snapshots, cannot see contents clearly...