Spearman Correlation Explained (Inc. Test Assumptions)

Вставка
- Опубліковано 28 вер 2024
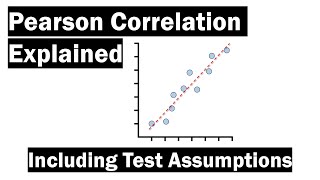
- In this video, I’m going to explain what a Spearman correlation test is and the assumptions behind it. Simply put, a Spearman correlation test, otherwise known as a Spearman’s rank-order test, measures the strength and direction of a monotonic association between two ranked variables.
HOW I CREATED THIS TUTORIAL (AFFILIATE LINKS)
Screen recorder & editor techsmith.z6rj...
UA-cam SEO www.tubebuddy....
Software (Microsoft PowerPoint 365 ProPlus)
FOLLOW US
Website toptipbio.com/
Facebook / toptipbio
Twitter / toptipbio
AFFILIATE DISCLAIMER
Some of the above links are affiliate links, meaning I will earn a commission if a sale is made after clicking on the link.


Thankyou - the clearest and easiest explanation for this I've came across!
Best explanation!! Easy to understand, I will absolutely look for other videos from you. This was extremely helpful!
Thanks Debbie :) glad it helped
Excellent and very clear presentation. You have amazing clarity and teaching skills. Thank you very much.
Excelente explicación del test de Spearman. Best explanation I have found. Easy to follow and crystal clear. Thank you!
very helpful when deciding criteria for which measure to use! thank you!!
I'm steadily watching your videos as a supplement to David Spiegelhalter's book: The Art of Statistics and they're incredibly helpful.
This was so easy to understand. you may have just saved my project.
Thank you for this. It was extremely well explained
This is stunningly brilliant!
I like this video!!! thank you for explaining it in such a cogent way.
Very easy to follow! Thanks for this video.
Very clear explanation!
great job, very well explained!!
Very rightly described 👍
Can you explain how ratio measure ments are continous
Helpful video, very clear and objective. Thanks!
Glad it was helpful!
increase your Voice Please,
Thanks for the Video, its really clear, keep it up
The example for "independence of observations" is misleading. The reason why you should not recruit the siblings to the experiment is because that goes against "random sample", which is a lot more difficult to avoid, so it is rather acceptable depends on the research question. Independence of observations mostly happen when the observations are made together in space or time, which should be taken into consideration in the experimental design. For example, checking the correlation between scores of two exams. If the two exams held back to back without any break. Then the result of second exam might be affected by fatigue level coming from the first exam (which turns the research question into how a person's fatigue level affects the result of second exam). This, however, can be avoided by placing a break in between the two exams and assuming that participant's fatigue level is more or less the same at the beginning of each exam.
Thanks💚
Great explanation!
If the numbers are in order for subjects.
Thanks for posting…however, it would be nice to know where the heck the ‘6’, a constant, comes from in the formula for Spearman, but not in formula in Pearson’s correlation? Why is it in the formula no matter what the other info is? This seems strange indeed! I’d love to know…Thanks.
Thank you so much
If the distribution is not normal but the variables are continuous, what type of test should I use to test the relationship between the two variables?
A point biserial correlation
Thank you
Hello, thank you for your video.
I am trying to find the relationship between Happiness (Ordinal variable with more than 5 categories) and Income (continuous variable). In this case, I am having trouble deciding if I should run Pearson correlation (by treating the happiness variable as continuous since it has more than 5 categories) or whether run a spearman's correlation?
Also, while I tried to check the assumption for Pearson correlation (treating happiness as continuous), I found that Income is not normally distributed. And when I generated a scatterplot for these two variables, the result is not clear and somehow visually indicates no linear relationship. What should I Do???
Can you please let me know what have you done?? I have the same situation.. I need to measure the releationship between two variables The weekly hours (ordinal) and engagement (scale)
Amazing!!!!
Thank you for the very comprehensive video. Only thing I missed is a quick word on how the value p is computed.
i still cant find this anywhere
what if I have a non monotonic association? Which correlation can I use?
Does ranked variables need to be ordered set or semi ordered set is allowed ? I feel semi ordered is sufficient to be monotonic.
Why do you say that it's necessary to give the two variables ranks in order to perform the test and then when you talk about performing a spearmans correlation test you show the table without the rank order.
done
Can this test be run for more than 2 variables?
ok
thank you
what if i dont know what the perason correlation coefficient is, I cant understand a single part of the video, bad examples too, fitness pain correlation with spearman just because you named the variables instead of had numerical value to represent the information.
Can you recommend how I might determine my power/sample size prior to performing this test?
Hi! What is the best way to plot a spearman correlation so that we clearly see the information that it is giving? I think it's not useful to plot a regression line as it depends on outliers, while the spearman correlation doesn't.
Thank you!!
thank you so much for your understandable explanation....but in the lectures that I got, we rank data starting from the smallest data. will it affect the results?
This video and the Excel tutorial on the website are about to save my ecology project! Thank you!
How does it calculate de p-value if on the spearman correlation the distribution is not normal ?
what if your hypothesis originally states that there IS a negative relationship , then you get a rho value of -0.2612922 and p value of 0.01042 what does this mean because its not -0.9 something which would indicate a strong negative? is it telling me there is a negative relationship but just not that strong?
If that's the case then you can conclude that the is a significant correlation. The coefficient value just suggests the magnitude of the correlation between the variables. You can still have a significant test with a low correlation value. The clinical significance of this will vary depending on what field of science you are studying. Hope that makes sense
what about references ?
nicely explained