Thank you for the very informative videos. I have just recently came across your videos while trying to display spatial data that contain anomalies in either y direction, x direction or both. Can you kindly suggest which plot I should adopt.
Most welcome! I think you're on the right track here. The jointplot would be able to show you your data's marginal distributions as well as the joint distribution, so you should be able to see anomalies in either the x- or y-directions. A bivariate KDE plot would be good to look for outliers that don't cluster with your other values, and you could plot that on the center part of the jointplot. You might also consider trying boxplots since they alert you to outlying values. But there you would need to plot the x- and y- directions separately to look for outliers.
Nice video. I have the following questions. If my hue column had many values and I want to know which colour means which value then what to do? Also, if I want to change the bin widths of the marginal histograms, then what should I do?
Great questions! Seaborn should include a legend for you by default, which will show you what each color means. If it doesn't add a legend by default, you could try adding legend=True as one of your keyword arguments within the jointplot function. And regarding the histogram bin widths, you can set these through the marginal_kws argument. For example, add sns.jointplot(..., marginal_kws={'binwidth': 10}). (Assuming you have the most recent version of Seaborn >= 0.11.0)
Hello! Is it possible to plot joint probability for three variables? I have been looking for an answer for a couple of days, however, I could not find any python library for that. Do you have any suggestion/idea?
Hello Kimberly, thank you for the excellent tutorials on Seaborn. Have followed them all on the computer. One question about this: How can I insert formula text into the graphs? For example, I would like to include the linear regression formula as text in Seaborn graphs. Thanks for your help already here. Vielen Dank und viele Grüße aus D. Kurt
Hi - great question. Seaborn does not currently have an automatic way to do this, but if you know what the formula is, you can add it through matplotlib pyplot's text function. So after you create the joint plot, add: plt.text(x, y, formula) where x and y are the x and y positions where you want the text to go and formula is your formula string. You can also use TeX to write the formula using TeX commands if you'd like. I have a few other videos that may be helpful: plt.text (ua-cam.com/video/NBYzSaTbodM/v-deo.html) and TeX for matplotlib (ua-cam.com/video/9473Sr7l8iY/v-deo.html). Cheers!
Hi, thanks for this great lesson on joint plots. I applied your method to the data we are using but noticed that for kind = 'hist' seaborn was giving us (you and me) very different default bin sizes. I must have at least 50 while you have about 10. Why might that be and how to take control over this?
Is there any other library in python that allows graphics like this? Also, I'm trying to do plt.subplots with sns.jointplot on the axes but is not working :(
The most common Python libraries for building graphics like these are matplotlib and seaborn. There's also pygal and altair or perhaps GeoPandas for mapping. If you'd like to add interactivity, Plotly and bokeh are nice. Regarding the subplots on the jointplot, the joinplot is based upon the JointGrid, which is already constructed of matplotlib subplots. This means the jointplot will not allow you to add additional subplots to its components. You can access the individual subplots of the jointplot by saving it's return object and then accessing the .ax_joint, .ax_marg_x, or .ax_marg_y components. So maybe you could do something fancy by updating those directly, but it would take some work!
Thanks a lot, Kimberly. Is there a way to plot multiple plots (multiple x,y) in one graph using joinplot??? since hue is not working for multiple tables
This video is really comprehensive! Thanks for making it!! I have a small question. What software do you use for editing your videos? I am looking for tools to start creating video content.
Thanks for videos, I have some questions. 1 - How can I get plotted values, so the joint probability density values as a data or matrix? 2 - How can I calculate probability density function for three random variables?
one request I post some words if you searched in google means you will amaze @Kimberly Fessel. smile marker for seaborn -- just copy-paste and tell what happened..
For sure! I'm planning to do a video about the new displot soon. The rest of my Seaborn videos can be found here: ua-cam.com/play/PLtPIclEQf-3cG31dxSMZ8KTcDG7zYng1j.html
You got it! Planning videos for the new displot and the lmplot soon. The rest of my Seaborn videos can be found here: ua-cam.com/play/PLtPIclEQf-3cG31dxSMZ8KTcDG7zYng1j.html
Thank you so much for your videos! I have a few questions however; 1) Is it possible to change the type of the marginal plots only (I would like my main plot to be a hexbin 2d histogram and the marginal plots to be KDE)? 2) How can I add a colorbar to a joint plot? The usual "cmap" doesn't work with the JointGrid object.
Hi there - great questions! For #1, you will want to check out the JointGrid. It's much more flexible than the jointplot. And I now have a video about it here: ua-cam.com/video/t3G078DWXBM/v-deo.html For #2: I haven't tried adding a colorbar to a jointplot, but it looks like it accepts an argument called "cbar" for some plot types; just set cbar=True in the jointplot. You can go on to adjust it or move it from there like in this resource: stackoverflow.com/questions/60845764/colorbar-for-sns-jointplot-kde-style-on-the-side
Thank you for these videos! I am a true beginner. And got confused when you end many rows with ; When do you use " ; " is it optional or does it come with Seaborn?
Such a great question! The ; is really just there to suppress the automatic output in Jupyter Notebook; it is optional. You can learn more about the semicolon in Python in my explanation here: ua-cam.com/video/B3M5ETKHEOY/v-deo.html
Wow, definitely very useful than reading the page. Is it possible to extract those "clusters" points from the kde plot? For instance I just want the points (cluster) only inside the core circle shown at 4:51.
Thanks, glad you enjoyed! KDE doesn't do clustering; it just provides an estimate for the probability density function. So I can't think of a super easy way to do this. Seaborn's KDE uses scipy's Gaussian KDE: docs.scipy.org/doc/scipy/reference/generated/scipy.stats.gaussian_kde.html#scipy.stats.gaussian_kde You could potentially use scipy to build a KDE with your data and then maybe filter down to the group you want based on those numeric values. But like I said -- not super simple! (Though interestingly enough, these geyser data have already been clustered with KMeans. That's what the "kind" column indicates: "short" and "long" clusters. So you could just filter based on one cluster or the other for this example. 😄)


Top, as usually! Thanks so much, Kimberly👋
Hi -- thank you and thanks for stopping by! 👋
Thank you so much Kimberly... This is amazing...
So glad you liked it!
What would I do if I only wanted to see the geysers that are 'Long' or only the geysers that are 'Short'?
thank you
Welcome! Cheers 😄
Best Tutorial for Seaborn on UA-cam. Keep up the great work Kimberly.
Thank you very much - will do!
Thank you for the very informative videos. I have just recently came across your videos while trying to display spatial data that contain anomalies in either y direction, x direction or both. Can you kindly suggest which plot I should adopt.
Most welcome! I think you're on the right track here. The jointplot would be able to show you your data's marginal distributions as well as the joint distribution, so you should be able to see anomalies in either the x- or y-directions. A bivariate KDE plot would be good to look for outliers that don't cluster with your other values, and you could plot that on the center part of the jointplot. You might also consider trying boxplots since they alert you to outlying values. But there you would need to plot the x- and y- directions separately to look for outliers.
Nice video. I have the following questions.
If my hue column had many values and I want to know which colour means which value then what to do?
Also, if I want to change the bin widths of the marginal histograms, then what should I do?
Great questions! Seaborn should include a legend for you by default, which will show you what each color means. If it doesn't add a legend by default, you could try adding legend=True as one of your keyword arguments within the jointplot function.
And regarding the histogram bin widths, you can set these through the marginal_kws argument. For example, add sns.jointplot(..., marginal_kws={'binwidth': 10}). (Assuming you have the most recent version of Seaborn >= 0.11.0)
Nice one ezpz
Thanks! 😊
Hello! Is it possible to plot joint probability for three variables? I have been looking for an answer for a couple of days, however, I could not find any python library for that. Do you have any suggestion/idea?
Thank you for this series, very helpful, with your help now I know how to read the plot too, lots of love!!
So glad you are enjoying it -- cheers!
Hello Kimberly,
thank you for the excellent tutorials on Seaborn. Have followed them all on the computer.
One question about this: How can I insert formula text into the graphs? For example, I would like to include the linear regression formula as text in Seaborn graphs.
Thanks for your help already here.
Vielen Dank und viele Grüße aus D.
Kurt
Hi - great question. Seaborn does not currently have an automatic way to do this, but if you know what the formula is, you can add it through matplotlib pyplot's text function. So after you create the joint plot, add:
plt.text(x, y, formula)
where x and y are the x and y positions where you want the text to go and formula is your formula string. You can also use TeX to write the formula using TeX commands if you'd like. I have a few other videos that may be helpful: plt.text (ua-cam.com/video/NBYzSaTbodM/v-deo.html) and TeX for matplotlib (ua-cam.com/video/9473Sr7l8iY/v-deo.html). Cheers!
How would we make a joinplot of only the "long" data?
this is about , each variable is dependent on one another right.
hoe to change the marker style for two different data?
Hi, thanks for this great lesson on joint plots. I applied your method to the data we are using but noticed that for kind = 'hist' seaborn was giving us (you and me) very different default bin sizes. I must have at least 50 while you have about 10. Why might that be and how to take control over this?
Hey there! You can past information about the bins through to marginal_kws. For example, add the property marginal_kws={'bins': 20} to make 20 bins.
Is there any other library in python that allows graphics like this? Also, I'm trying to do plt.subplots with sns.jointplot on the axes but is not working :(
The most common Python libraries for building graphics like these are matplotlib and seaborn. There's also pygal and altair or perhaps GeoPandas for mapping. If you'd like to add interactivity, Plotly and bokeh are nice. Regarding the subplots on the jointplot, the joinplot is based upon the JointGrid, which is already constructed of matplotlib subplots. This means the jointplot will not allow you to add additional subplots to its components. You can access the individual subplots of the jointplot by saving it's return object and then accessing the .ax_joint, .ax_marg_x, or .ax_marg_y components. So maybe you could do something fancy by updating those directly, but it would take some work!
Wow !!!! i just found you channel and is incredible! Thanks)] :)
Oh thank you! Welcome - and glad you are enjoying my channel!
on what basis histogram is ploted
Thanks a lot, Kimberly.
Is there a way to plot multiple plots (multiple x,y) in one graph using joinplot??? since hue is not working for multiple tables
This video is really comprehensive! Thanks for making it!!
I have a small question. What software do you use for editing your videos?
I am looking for tools to start creating video content.
Great work , thnks for sharing with us
Of course! Glad you liked it 😁
Thanks for videos, I have some questions.
1 - How can I get plotted values, so the joint probability density values as a data or matrix?
2 - How can I calculate probability density function for three random variables?
one request I post some words if you searched in google means you will amaze @Kimberly Fessel.
smile marker for seaborn -- just copy-paste and tell what happened..
you can see the beautiful smile of our professor.
Seaborn is my favorite! 😄Looks like Google knows that now... 😂
@@KimberlyFessel Google knows everything !
Great stuff. Thanks Kimberly!
can you please upload more videos on seaborn.
For sure! I'm planning to do a video about the new displot soon. The rest of my Seaborn videos can be found here: ua-cam.com/play/PLtPIclEQf-3cG31dxSMZ8KTcDG7zYng1j.html
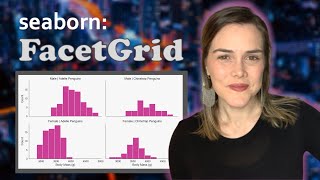
mam can u please upload video on facegrid, pairgrid and lmplot. Thank you for this awesome series
So glad you are enjoying the series, and yes, I do plan to make videos on the FacetGrid, PairGrid, and lmplot!
More about Seaborn, please.
You got it! Planning videos for the new displot and the lmplot soon. The rest of my Seaborn videos can be found here: ua-cam.com/play/PLtPIclEQf-3cG31dxSMZ8KTcDG7zYng1j.html
Thank you, great video.
Amazing video!
Glad you think so!
Thank you so much for your videos! I have a few questions however;
1) Is it possible to change the type of the marginal plots only (I would like my main plot to be a hexbin 2d histogram and the marginal plots to be KDE)?
2) How can I add a colorbar to a joint plot? The usual "cmap" doesn't work with the JointGrid object.
Hi there - great questions! For #1, you will want to check out the JointGrid. It's much more flexible than the jointplot. And I now have a video about it here: ua-cam.com/video/t3G078DWXBM/v-deo.html
For #2: I haven't tried adding a colorbar to a jointplot, but it looks like it accepts an argument called "cbar" for some plot types; just set cbar=True in the jointplot. You can go on to adjust it or move it from there like in this resource: stackoverflow.com/questions/60845764/colorbar-for-sns-jointplot-kde-style-on-the-side
Thank you for these videos! I am a true beginner. And got confused when you end many rows with ; When do you use " ; " is it optional or does it come with Seaborn?
Such a great question! The ; is really just there to suppress the automatic output in Jupyter Notebook; it is optional. You can learn more about the semicolon in Python in my explanation here: ua-cam.com/video/B3M5ETKHEOY/v-deo.html
This is amazing! Thanks!
Most welcome! Glad you liked it 👍
@@KimberlyFessel Loved your videos and learned a lot! Could you please develop videos or a complete Playlist on Plotly.
We should support women in tech. Heads of to you . And i love you
Thanks for the support!
Very helpful seaborn series!! Loving it!!!
Awesome - so glad these videos have been helpful!
Wow, definitely very useful than reading the page. Is it possible to extract those "clusters" points from the kde plot?
For instance I just want the points (cluster) only inside the core circle shown at 4:51.
Thanks, glad you enjoyed! KDE doesn't do clustering; it just provides an estimate for the probability density function. So I can't think of a super easy way to do this. Seaborn's KDE uses scipy's Gaussian KDE: docs.scipy.org/doc/scipy/reference/generated/scipy.stats.gaussian_kde.html#scipy.stats.gaussian_kde You could potentially use scipy to build a KDE with your data and then maybe filter down to the group you want based on those numeric values. But like I said -- not super simple! (Though interestingly enough, these geyser data have already been clustered with KMeans. That's what the "kind" column indicates: "short" and "long" clusters. So you could just filter based on one cluster or the other for this example. 😄)
@@KimberlyFessel Great! Thank you, Dr. Kimberly, for your didactic support! :)
nice video, thank you teacher, great person.
Awww -- thank you! Glad to hear you liked the video. 😄
excellent seaborn tutorial so far , i have ever seen
So glad you are enjoying it!
Awesome educator!!!!
Thanks so much!
Thank you so much!!!
Awesome -- you're welcome!