Introducing Time Series Analysis and forecasting

Вставка
- Опубліковано 26 січ 2025
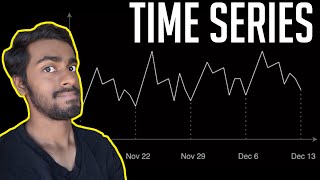
- This is the first video about time series analysis. It explains what a time series is, with examples, and introduces the concepts of trend, seasonality and cycles.
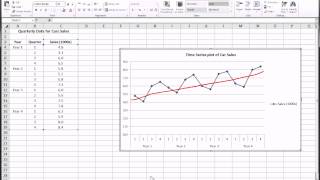
For more about time series, and using Excel for time series forecasting, see • Time Series forecastin...
#DrNicStats #Statistics #TimeSeries


Thank you professor! You explained briefly something that my university professor took longer and made seem more complicated
Glad it helped! I think university professors can find it difficult to know how to explain things simply. I was one for 20 years, and my videos build on my experience.
Lecturer can never come down to pace of every student. Meanwhile you'll have student who would get it more than you do.
This is a really, really good introduction to time series data analysis. Thanks you.
Thank you - I've been teaching it for a while. You might like the one about time series in Excel as well. ua-cam.com/video/OyrheHnQLPg/v-deo.html
Great intro Prof. I have a recommendation. Can you make a video comparing time series and simple regression lines. This is an excellent way to elucidate the concept of time series to individuals who are completely unfamiliar with it.
yes please me too
trader here - need to balance trend channel with trends, seasonality, cycles & variation/outliers
The “irregularities” has been the most relevant factor in 2020 ( and may be in 2021 as well ) 😢
So true! In NZ we had a bad earthquake in our census year so the census had to be moved from its usual 5 yearly interval. Forever we will need to adjust due to that. Time series really do tell stories.
Thankyou professor!!!Loved the explanation........From India
Most welcome!
Great Video, thanks for sharing knowledge
Most welcome
Well done Dr Nic. The book took 40 pages to explain what you did in 3 minutes on a video.
Glad I could help clarify
Fantastic explanation.
Thank you so much
From India
the simplest yet best explanation.thanks
Glad it helped. Simple explanations are often more difficult to give, so being called the simplest is a high honour.
Can Discuss whether or not all time-series data can be used in forecasting?
Time series data is only useful if the past is a good predictor of the future. Currently with the world facing climate change and the pandemic, much data is no longer useful for predicting.
short & well explained ,saving the time ..thanks for such a quality of time
Glad you liked it
1:09 those examples couldnt be more accurate today especially here in Greece Heat Gas Oil and Electricity
great video. I was wondering if you could suggest a statistical test for comparing means? I have annual deforestation data for Brazil and want to compare the mean values (for each each year) over time (2000-2020) to understand if there were trends in the rates over time e.g. increasing / decreasing. Any suggestions would be greatly appreciated, thanks.
HI Catherine. You are not actually comparing means in the statistical sense, but rather the time series happens to be mean values. The most important thing to do is graph the data. You only have 20 data points. There will not be seasonality, but you may be able to say something about the trend.
Good video thank you
Glad you enjoyed it
Do you have a video on time trend analysis for health conditions at a population level. For example, diabetes .
Sorry - that is a little specific for my channel.
@@DrNic what about general time trend statistics?
Hello Dr Nic
I want to thank you for the quality of your videos
I'm new in data analysis and want to learn more so if you could suggest for me the playlist that i should start with
it will help me
thanks :)
We have the videos organised on our website here: creativemaths.net/videos/
Dear Dr. Nick, Thank you for your videos... I want an introduction to time-series analysis to reveal dynamic or time dependent fluctuating properties wrt differences in gait cycle variability and fluctuations. Can you please suggest me some links to the related videos.
Sorry - this is outside my area of expertise.
@@DrNic Thank you for reply, can you please suggest me some1 who can guide me on this?
I have multivariante time series data where I have condition and control across time. What test should I use to know their significance between these two data.
Are you trying to find out if there is a difference between means? You might like to watch my video about statistical significance as the way you have used the word is not really valid in statistics. ua-cam.com/video/pwBW1aWic_Y/v-deo.html
well explained mam...... keep posting
Thank you, I will
I like your videos and it is very simple and understand and make more videos in this topic and suggest best book to learn time series, index numbers it will help for prepare my exam and lots of love from India🇮🇳 I hope u will reply for my message
I'm glad you like my videos. Sorry I don't know what book to recommend. You have given me an idea to make a video about index numbers! Have you seen this video - it is not just about Excel ua-cam.com/video/OyrheHnQLPg/v-deo.html
@@DrNic thank you 🙏 for spending your valuble time for me and if you have Instagram account please tell me i can follow you it help to me
How can I calculate annually and semiannually cycle(oscillation) of temperature data?
Find an academic study that has done this, and use that as your guide. I suspect you will need to use a smoothing method.
Hi Dr Nic, I'm currently finding methods to predict future petrol oil prices for my maths assesment. May I ask which method is suitable to predict petrol oil prices?
It depends on whether you are taking other things into account or just using a time series of petrol prices. If it is a time series, plot it and look for seasonality and trend. If you are taking other aspects into account you will want to fit a regression line.
@@DrNic I see! Thanks a lot Dr Nic. May I ask what are examples for other aspects?
10 out of 10 video
Why thank you!
Nice
Thanks
💓👌
love u Ma'm
really thanks
Most welcome
TQ
YW
Can you share the email pls
For?
@@DrNic Need a support for my research
@@isurusenevirathne I’m not available - sorry.
@@DrNic ok , who are the best supervisors fro time series
Paywall, disliked
I agree, it is a pity I can not provide everything for free.