Particle Size Distribution Curve ,Sieve analysis test

Вставка
- Опубліковано 15 лис 2021
- My work as Assistant Lecturer In college and I worked For 5 years In soil lab, I explained the soil tests for undergraduate students, I tried to give you my experience through this tutorial, if you have any misunderstanding please inform me in a comment, I try to answer as soon as possible.
#Sieve_Analysis_Test
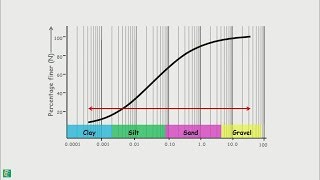
particle size distribution curve
sieve analysis
gradation curve
sieve analysis test
grain size analysis
sieve analysis of coarse aggregate
sieve analysis of fine aggregate
grain size distribution curve
sieve analysis of sand
sieve test
sieve analysis of soil
sieve analysis graph
sieve analysis procedure
sieve analysis of aggregates
sieve analysis of fine and coarse aggregates
fine aggregate sieve size
astm sieve analysis
particle size distribution graph
particle size distribution test
grain size analysis of soil
coarse aggregate sieve size
particle size distribution curves, particle size distribution curve excel, particle size distribution curve excel template, particle size distribution, sieve analysis, soil mechanics


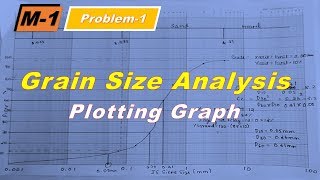


This video teaches me both particle size analysis and using spreadsheets to construct a graph
Glad it was helped, and thank you so much for your support
Very good explanation, thank you so much
You are welcome, I’m happy to hear that
Kepp going teacher amazing job
Thank you so much
well explained. Many thanks.
Glad to hear
Good job👍
Welcome
Very well explained
Glad to hear
Very good explanation
Thank you
It is very useful thanks
You are welcome
Thanks for the splendid explaination. What if CC and CU are zero? How would the soil be classified?
A soil is considered well-graded if Cu is greater than 4 for gravels and greater than 6 for sands, and Cc is in the range of one to three. Soil is considered poorly graded if Cu or Cc does not fall within these two ranges
@@ENGSchool, thank you kindly.
How do you workmout the % gravel?
In this example there are no gravel, the same way as determining sand and silt, gravel can be determined, according to ASTM the range of gravel is 4.75 mm to 75mm
من فضلكم حسبت معامل النعومة للرمل وجدته اكبر من10هل لهذا تفسير؟
Translate to English please