Thank you Mr turdfurg67! this was so short and informative glad i found this video, yes ppl are still interested in log log graphs in 2023. "peace out and I love you america"
What is the name of that type of paper? I've been searching for 2 cycle log paper but I could never find the one with the same 'pattern' as the one you are showing in this video :(
It's called "National Brand Engineering Forms" number 12-185. It's awesome. I used to get it on amazon, but they have been out of stock. Right now I've been photocoping it for my students. Don't tell.
Ok so you are entering the realm of independent and dependent axis. Most of the time you can still get an answer to what you are doing. Without regard to what some would say it's all about you understanding what you graphed to understand the regression. In this case we were trying to fit a formula given . You can see me fitting it to y=mx+b at about 1.58 in the video. We had to put the axis in our example that way to fit the formula. I can a log graph on anything. Even newton's F=ma. If I did a lab of constant mass, then I could lnF versus lna. My slope would be 1 (showing a direct relationship).
9 months late... You can, but you have to graph the log of each data point. It's not an advantageous way to do it, but you also get to say I'm one of about 10,000 people alive that can even do a log-log graph lol.
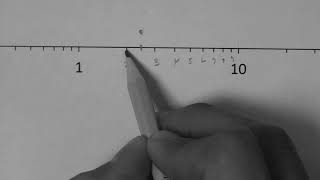
@@flyingrichard On log-log graph paper, the distance between numbers isn’t linear but logarithmic. This means that numbers like 1.5, 2, and 3 are spaced according to the logarithm of the numbers. However, the grid lines on the paper are typically marked at conventional intervals (1, 1.5, 2, etc.) for convenience, even though the spacing is determined by their logarithmic values. Why is 1.5 between 1 and 2, not 1.3? The numbering on the log-log paper is set up to provide a consistent and understandable way to interpret the data. On a logarithmic scale, when you look at the segment between 1 and 2, the numbers are spaced according to their logarithms: log10(1)=0 log10(1.5)≈0.176 log10(2)=0.301 Increments like 1.1, 1.2, 1.3, etc., have logarithms that are close together, and if the graph had to show all those numbers, it would be cluttered. Therefore, graph paper is designed with more common or “round” numbers like 1.5 marked clearly, allowing you to easily identify these numbers without having to deal with every small increment. The spacing allows for a simple and practical way to plot data on a log-log scale. So, 1.5 is placed between 1 and 2 because it provides a convenient and clear way to mark the scale, aligning with the typical use of standard number conventions on such paper. This makes it easier to read and plot data, even though the actual spacing is based on logarithms.


your accent makes this 65748 times better. thank you this video was very helpful.
Maybe I should change the channel to "Down South Physics" lol. Thanks for watching.
best video on youtube for explaining this....deserves millions of views
Thanks :)
Thank you Mr turdfurg67!
this was so short and informative glad i found this video, yes ppl are still interested in log log graphs in 2023.
"peace out and I love you america"
Mr Turdfurg67....That's my fathers name. You can just call me turd lol
This really helps. Also, love the accent.
how did i miss this, accent comments are my fav. Alabama reaching the world!
Thanks. I needed it for my homework on Metal Forming Processes (Engineering) to plot stress (sigma) versus strain (epsilon) on a log - log graph.
Thanks! Just the vid I needed to finish my Physics report! Did you study physics too?
Cheers Mate :)
You explained it very well :)
Thank you for your clear explanation, you helped me a lot.
I'm just glad to know someone is still doing log graphs in the age of excel. :)
5:31 Can anyone answer me ? I think 1.5 is not in the middle. 1.3 should be in the middle 😢 if it is the log scale.
You save lives here❤❤❤❤
New TV show... "Turdfurg MD Life Saver", I wonder if Chris Hemsworth would go for the role?
Thanks! Your video was really helpful.
10:19 you sing so well
how did I ever miss this comment. Thanks a ton :)
Hahahha
thank u from Brazil!
You made my day
Thanks a lot
Subscribed
Thanks, It really helped me. channel subscribed, very easy going and helpful.
that was awesome. thanks a lot.
I'm just glad someone is still interested in log graphs in 2022.
Thanks man, was very helpful
thank you .... that was so helpful !
Thanks you helped me a lot ♥️
Much kinder than the person that was upset the video wasn't about logging lol.
What is the name of that type of paper? I've been searching for 2 cycle log paper but I could never find the one with the same 'pattern' as the one you are showing in this video :(
It's called "National Brand Engineering Forms" number 12-185. It's awesome. I used to get it on amazon, but they have been out of stock. Right now I've been photocoping it for my students. Don't tell.
thank you for your response :)
I really love it but I would like to learn on how to plot a graph of Log l against Log T
Would putting T on the x axis and L on the y axis be wrong ?
Ok so you are entering the realm of independent and dependent axis. Most of the time you can still get an answer to what you are doing. Without regard to what some would say it's all about you understanding what you graphed to understand the regression. In this case we were trying to fit a formula given . You can see me fitting it to y=mx+b at about 1.58 in the video. We had to put the axis in our example that way to fit the formula. I can a log graph on anything. Even newton's F=ma. If I did a lab of constant mass, then I could lnF versus lna. My slope would be 1 (showing a direct relationship).
Very helpful
Thanks, Sir.
I have a question. What's the point in doing all this on log-log graph? We could do the same thing on normal graph paper and get the same solpe.
9 months late... You can, but you have to graph the log of each data point. It's not an advantageous way to do it, but you also get to say I'm one of about 10,000 people alive that can even do a log-log graph lol.
thank you it helped a lot
I'm just relieved that someone other than me, still thinks students should be able to do this :-/
Glad it helped :-)
Hi which drawing software did u use in this video
Thank you for your effort
You can't put a unit to the slope
very helpful 👍,
Where can i get ot on internet
thanks
1.5 is not in the middle of 1 and 2 on a log scale
it's in the middle on the graph paper, which is what the video is about.
@@turdfurg67 That is want I think too. 1.5 is not in the middle. 1.3 should be in the middle 😢 if it is the log scale
@@flyingrichard On log-log graph paper, the distance between numbers isn’t linear but logarithmic. This means that numbers like 1.5, 2, and 3 are spaced according to the logarithm of the numbers. However, the grid lines on the paper are typically marked at conventional intervals (1, 1.5, 2, etc.) for convenience, even though the spacing is determined by their logarithmic values.
Why is 1.5 between 1 and 2, not 1.3?
The numbering on the log-log paper is set up to provide a consistent and understandable way to interpret the data. On a logarithmic scale, when you look at the segment between 1 and 2, the numbers are spaced according to their logarithms:
log10(1)=0
log10(1.5)≈0.176
log10(2)=0.301
Increments like 1.1, 1.2, 1.3, etc., have logarithms that are close together, and if the graph had to show all those numbers, it would be cluttered. Therefore, graph paper is designed with more common or “round” numbers like 1.5 marked clearly, allowing you to easily identify these numbers without having to deal with every small increment.
The spacing allows for a simple and practical way to plot data on a log-log scale. So, 1.5 is placed between 1 and 2 because it provides a convenient and clear way to mark the scale, aligning with the typical use of standard number conventions on such paper. This makes it easier to read and plot data, even though the actual spacing is based on logarithms.
Thankyou
Hey Brother...which software do you use??
smart notebook software 16.1
Can i change the scale?
as long as it's by powers of 10
Watch at 1.5x...thank me later;)
Seems like I'm the only one here that didn't understand 😢 and i have to remain my tp tomorrow
Just a heads up, video is great however when you log a value the units disappear therefore there are no units for lnT and lnL
you right (banging fist on table)