This video was really helpful. I have a question: Is it possible to use the ROI Wand tool to measure the intensity of two or more cells simultaneously? I want to measure the intensity of certain cells, not all of them.
Hello, thanks for reaching out. The measurement is based on selections. Selections can be done either using the Wand tool like you mentioned as well as using the command options as demonstrated in this video. Either way is correct.
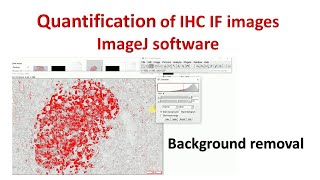
Hello thank you for the video. Really helped. However i have an issue. When i click clear outside all image becomes red or clear the nuclei becomes red. It doesnt become black. Do you have any suggesions?
Thank you. Glad you found it helpful. Right click on the color picker, select colors, and change the background color to black. Let me know if the issue still persists.
Hi, thank you so much for this interesting video. Do you think that could be correct to correlate the fluorescence intensity (in terms of intden) to the area expressed in microns? If yes, CF=Intden-area (um2) could be a right formula? Thanks again.
Hello, you are welcome. Here is an interesting forum that discuss about calculating intden forum.image.sc/t/mean-gray-intensity-integrated-density-and-raw-integrated-density/4983/2
Can you tell please, how to know the optical density for mast cells (stained with toluidine blue) in order to classify them in different types according to their staining intensity
Hello, have a look at this forum discussion forum.image.sc/t/mast-cells-quantification-toluidine-blue-stained-skin-epidermis-dermis/79478 if you need the weka segmentation according to this discussion here is the link to the video ua-cam.com/video/tmPr5Iw_9XY/v-deo.html
Thank you for this video! I'm new to ImageJ (using it for a university course) and though this process wasn't possible in the application. You helped me a lot. I have one question: Is there an option to select nuclei that only have over a certain minimum of expression? (your example has perfect nucelei but in mine it is not possible to completely cover the area's of the nuclei without also including background.
You are welcome. I'm assuming the background is blue due to DAPI staining of the nuclei. Because DAPI staining only serves to identify the location of nuclei/cells (and does not account for staining intensity measurement of cytoplasm/nuclear with different color staining), the brightness/contrast or remove background functions can be used to decrease background staining. First, split the image and adjust the background with only the blue DAPI channel. Let me know if this works for you. I have a similar video on troubleshooting how to process image with similar background color. ua-cam.com/video/xeAuh_E8z8k/v-deo.html
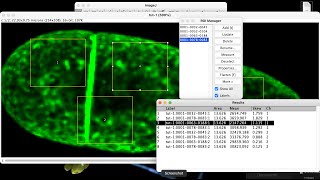
Hello and thank you for the video, it is very helpful! I would like to ask you if it is possible to have a list of intensity for each cell and not from all the cells together
you are welcome. listing intensity of each cells would require a ROI/specific boundary/selection of each cells while thresholding. in this video the selection command uses "select all". However, to do individual selection either the cells do not adhere/touch one another or a manual seperation would be needed. For instance the DAPI is already seperated in this video. during the analyze and measure steps check the "add to manager" option in the ROI manager window to get individual cell intensity. Here is a demo video ua-cam.com/video/hpxnbJ_8EE4/v-deo.html where i analyzed the intensity of each DAPI seperately.
Hello, thanks for reaching out. ImageJ splits an RGB image into red, green, and blue color channels. In this image, the immunostaining colors are red (cytoplasmic) and blue (dapi), and only the red immunostaining will be quantified. This image shows no green immunostaining and therefore no quantification needed for this channel. As a result, the green channel image is not considered.
Hi, I haven't done sub-segmentation so far. Not quite sure how to do it. I will get back to you if I figure it out. Thanks for watching my UA-cam videos.
It's fantastic to hear that my video was useful. If you have any questions or require clarification on any of the topics presented in the video, please feel free to reach out. Best of luck with your thesis.
to calculate the Nuclear/Cytoplasmic ratio, simply divide the staining mean intensity i,e MEAN of nuclear/ mean of cytoplasmic. The Mean value is in the results window.
Hello nrtTaye, thanks for this video. However, I keep getting threshold not set for the cytoplasm intensity measurement. What may be the cause of this?
Hi please check if this parameter was unintentionally introduced ....The threshold (255-255) may not be correct. If the image can be shared I could look into it.
Hello nrtTaye.Thank you for this detailed video. I want to ask three questions: 1. When using this method for nuclear density measurement, do we need to measure the mean value of the background by selecting an empty area close to the nucleus? Can we reach the real value by subtracting the background mean value from the nucleus mean value, or is there no need to do this since we have thresholded? 2. Does applying a Gauss filter to the fluorescent image to be studied before thresholding it change the mean value? 3. Should we set scale before starting the analysis? Thank you in advance.
Hello, thanks for the question. I am sure this discussion will benefit other viewers as well. 1) Since the analysis will be accounted only for the thresholded area, therefore a background subtraction may not be required. During threshold, if the background is also selected, then background subtraction may be required. 2) Pixel values are changed in an image when a Gaussian filter is applied. Because the Gaussian filter eliminates high-frequency noise and features, it tends to somewhat blur the image. The pixel values may be affected by this blurring, particularly at the margins and when the image transitions between distinct areas. A filter with a very little standard deviation that has a small smoothing impact should be used instead of a Gaussian filter if you're doing pixel intensity analysis and need to maintain the original pixel values without any smoothing. 3) if the image has a scale bar, yes, it needs to be set before starting the analysis.
Thank you for your help @@nrttaye4033. I want to ask two question: Q1) Which value represents the "Total intensity / number of pixels" in the result table? Area, mean or another? Q2) I tried calculating the background in the red channel I obtained after the split channel command. Before applying a threshold to this channel, the background mean value is measured as "0". I think I won't be able to determine the background mean value when I apply this method. Can you suggest a method to measure the average fluorescence intensity of the Nucleus and Cytoplasm that I can process to subtract the background? Thank you so much...
@@zeynepaltinisik6907 Hello again, here are your answers 1) Mean 2) please see this video from 1:36 to 2:36 mins. It shows how to subtract background. ua-cam.com/video/d1MZ08HWhlU/v-deo.html once you split the image, subtract the background as shown in the video and then proceed. You are welcome and let me know if that worked for you.
I keep getting NaN when I press Clear for the cytoplasmic measurement. It works well for the nuclear measurement when I click clear outside. Why do you think this is happening? Thank you for the video!
Hello, could you please check if the "NaN empty cells" option is checked? it needs to be unchecked. you can find it in, Analyze ....set measurements....NaN empty cells....click ok. Let me know if that worked for you.


This video was really helpful. I have a question: Is it possible to use the ROI Wand tool to measure the intensity of two or more cells simultaneously? I want to measure the intensity of certain cells, not all of them.
Hello, thanks for reaching out. The measurement is based on selections. Selections can be done either using the Wand tool like you mentioned as well as using the command options as demonstrated in this video. Either way is correct.
@nrttaye4033 Thanks! I am facing problem in selecting more than one cell using the wand tool. Can you help how to troubleshoot that?
Hello thank you for the video. Really helped. However i have an issue. When i click clear outside all image becomes red or clear the nuclei becomes red. It doesnt become black. Do you have any suggesions?
Thank you. Glad you found it helpful. Right click on the color picker, select colors, and change the background color to black. Let me know if the issue still persists.
It worked thak you! @@nrttaye4033
Hi, thank you so much for this interesting video. Do you think that could be correct to correlate the fluorescence intensity (in terms of intden) to the area expressed in microns? If yes, CF=Intden-area (um2) could be a right formula? Thanks again.
Hello, you are welcome. Here is an interesting forum that discuss about calculating intden forum.image.sc/t/mean-gray-intensity-integrated-density-and-raw-integrated-density/4983/2
Can you tell please, how to know the optical density for mast cells (stained with toluidine blue) in order to classify them in different types according to their staining intensity
Hello, have a look at this forum discussion forum.image.sc/t/mast-cells-quantification-toluidine-blue-stained-skin-epidermis-dermis/79478 if you need the weka segmentation according to this discussion here is the link to the video ua-cam.com/video/tmPr5Iw_9XY/v-deo.html
How can we measure the intensity of backgound? To calculate the corrected total cell fluorescence.
Hello, thanks for reaching out. Here is the video to calculate CTCF ua-cam.com/video/WDGmrj4_T1o/v-deo.html
Thank you for this video! I'm new to ImageJ (using it for a university course) and though this process wasn't possible in the application. You helped me a lot.
I have one question: Is there an option to select nuclei that only have over a certain minimum of expression? (your example has perfect nucelei but in mine it is not possible to completely cover the area's of the nuclei without also including background.
You are welcome. I'm assuming the background is blue due to DAPI staining of the nuclei. Because DAPI staining only serves to identify the location of nuclei/cells (and does not account for staining intensity measurement of cytoplasm/nuclear with different color staining), the brightness/contrast or remove background functions can be used to decrease background staining. First, split the image and adjust the background with only the blue DAPI channel. Let me know if this works for you. I have a similar video on troubleshooting how to process image with similar background color. ua-cam.com/video/xeAuh_E8z8k/v-deo.html
First good job 💙💙
Thank you. Glad you like it.
Hello and thank you for the video, it is very helpful! I would like to ask you if it is possible to have a list of intensity for each cell and not from all the cells together
you are welcome. listing intensity of each cells would require a ROI/specific boundary/selection of each cells while thresholding. in this video the selection command uses "select all". However, to do individual selection either the cells do not adhere/touch one another or a manual seperation would be needed. For instance the DAPI is already seperated in this video. during the analyze and measure steps check the "add to manager" option in the ROI manager window to get individual cell intensity. Here is a demo video ua-cam.com/video/hpxnbJ_8EE4/v-deo.html where i analyzed the intensity of each DAPI seperately.
Can I know why the green channel is excluded for fluorescence please?
Hello, thanks for reaching out. ImageJ splits an RGB image into red, green, and blue color channels. In this image, the immunostaining colors are red (cytoplasmic) and blue (dapi), and only the red immunostaining will be quantified. This image shows no green immunostaining and therefore no quantification needed for this channel. As a result, the green channel image is not considered.
Thank you for this very informative and easy to follow video! It helped me tremendously!! 🔬
Thank you so much for watching and finding the video useful! I'm really glad it was helpful for you.
Great video. Is it possible to segment cytoplasm furthee into sub regiins and do the analysis
Hi, I haven't done sub-segmentation so far. Not quite sure how to do it. I will get back to you if I figure it out. Thanks for watching my UA-cam videos.
your videos are so helpful for my thesis work. Thank you for sharing with us.
It's fantastic to hear that my video was useful. If you have any questions or require clarification on any of the topics presented in the video, please feel free to reach out. Best of luck with your thesis.
Great work
Thank you. Glad you like it.
How do we calculate the intensity after that?
to calculate the Nuclear/Cytoplasmic ratio, simply divide the staining mean intensity i,e MEAN of nuclear/ mean of cytoplasmic. The Mean value is in the results window.
Thank you nrtTaye for this video! I have the same problem with the cytoplasm intensity ( threshold 255-255), Do you know how to fix this?
You are welcome. I may be able to sort it out step by step. Thanks
Hello nrtTaye, thanks for this video. However, I keep getting threshold not set for the cytoplasm intensity measurement. What may be the cause of this?
Hi please check if this parameter was unintentionally introduced ....The threshold (255-255) may not be correct. If the image can be shared I could look into it.
Hi @nrtaye. Great video. I am encountering the same problem. Please help, response you gave doesn't mention what to do. Thanks.
Excellent video with excellent explanation!
Many thanks! Glad you enjoyed it
Thank you!! Nice elaboration
Thank you Dr. Weam. I am so happy that the tutorials are useful and easy to follow.
Hello nrtTaye.Thank you for this detailed video. I want to ask three questions:
1. When using this method for nuclear density measurement, do we need to measure the mean value of the background by selecting an empty area close to the nucleus? Can we reach the real value by subtracting the background mean value from the nucleus mean value, or is there no need to do this since we have thresholded?
2. Does applying a Gauss filter to the fluorescent image to be studied before thresholding it change the mean value?
3. Should we set scale before starting the analysis?
Thank you in advance.
Hello, thanks for the question. I am sure this discussion will benefit other viewers as well.
1) Since the analysis will be accounted only for the thresholded area, therefore a background subtraction may not be required. During threshold, if the background is also selected, then background subtraction may be required.
2) Pixel values are changed in an image when a Gaussian filter is applied. Because the Gaussian filter eliminates high-frequency noise and features, it tends to somewhat blur the image. The pixel values may be affected by this blurring, particularly at the margins and when the image transitions between distinct areas. A filter with a very little standard deviation that has a small smoothing impact should be used instead of a Gaussian filter if you're doing pixel intensity analysis and need to maintain the original pixel values without any smoothing.
3) if the image has a scale bar, yes, it needs to be set before starting the analysis.
Thank you for your help @@nrttaye4033. I want to ask two question:
Q1) Which value represents the "Total intensity / number of pixels" in the result table? Area, mean or another?
Q2) I tried calculating the background in the red channel I obtained after the split channel command. Before applying a threshold to this channel, the background mean value is measured as "0". I think I won't be able to determine the background mean value when I apply this method. Can you suggest a method to measure the average fluorescence intensity of the Nucleus and Cytoplasm that I can process to subtract the background?
Thank you so much...
@@zeynepaltinisik6907 Hello again, here are your answers
1) Mean
2) please see this video from 1:36 to 2:36 mins. It shows how to subtract background. ua-cam.com/video/d1MZ08HWhlU/v-deo.html
once you split the image, subtract the background as shown in the video and then proceed.
You are welcome and let me know if that worked for you.
Thank you nrtTaye. This solution worked for me :)
@@zeynepaltinisik6907 Welcome. Glad that worked for you :)
I keep getting NaN when I press Clear for the cytoplasmic measurement. It works well for the nuclear measurement when I click clear outside. Why do you think this is happening? Thank you for the video!
Hello, could you please check if the "NaN empty cells" option is checked? it needs to be unchecked. you can find it in, Analyze ....set measurements....NaN empty cells....click ok. Let me know if that worked for you.