Thanks for the wonderful video... means a lot!! Kindly request you provide files, prepare three financial statements, and create a dashboard... in a continuing process... preparation of statements, creating and presenting in dashboard
Good job, ROI in the analysis sheet , how much was calculated based on the previous information like net profit and income? As everyone knows ROI is net profit over investment cost Kindly provide us more clarification about this
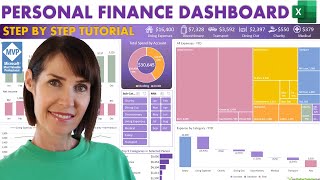
All the data here is hypothetical. Here I focused on the visualization part rather than the financial part. I try to teach how to present the data more beautiful way. But thanks for you nice input 🙂😀
Thank you for your content, that was a really great explanation. i have one question how do you connect the link from the drop down list to colomns d30 with google sheet. cause i've tried but it failed. could you please eloberate this. thank you in advance.
Hey, thank you for amazing work, but I need your help, I'm training now, but I couldn't get same result as yours (6:53mins) could you type that formula please, I wrote same but there's no result
Nigora, If you are using the same data log from my download link, then the formula is: =MAX(D6:O6)*1.25 Still have confusion? feel free to mail us at: Learningx.Tuitorial@gmail.com
Just for better visualization... If you multiply it by 1.25. Then the chart data line will not cover fully when the max number of that data set comes for comparison.. So its looks better.....If you want you can give it 1.1 or 1.2 or nothing, or just skip it as the effect is not so high....Not a major fact. 😊😊
@@LearningXOnline can you please elaborate this. I tried reading your explanation but I still can't figure out what you mean. In my excel sheet when I multiply, the data points in the donut chart indicate values higher than the ones on the income statement. Or it doesn't matter because you later use a text box to write down the actual value of the ROI for example.
I multiplied this with 1.25 to show a gap in the donught chart when it's the max value. Example, higher the multiplication number means higher the gap in the donught chart (yellow portion). If you don't multiply, then for max value , donught chart will be fully covered by black portion. It's don't look so good. So I did this. You can skip it. Not a major fact.
@@LearningXOnline well I can simply compare present income with previous one. So I don't have to multiply with 1.5 and the donut chart will also show comparison between two income tables. I got what you wanted to show..thanks BTW
Sir actually when you link the first text box to ROI I also did the same but mine is got linked but didn't get the same result it's not showing ROI written on it
Make sure the cell you have linked, ROI is written there. If done. Then also check is the font colour in the shape is black. Sometimes it stay white, so you can't see. Make the font black in shape. 🙂
Damera thanks for the comment. I have done this for not showing the donut charts to be 100% full. Just for visualization. You can ignore this or you can multiply it with any number. No effect on data, just for visualization. Check other comments, there I did reply too. For more query mail me at: Learningx.Tuitorial@gmail.com
Yes Ramil it's available in MS Excel. But you have to enable developer mode from File----> Options-----> Customize Ribbon------> Tick on developer option from the main tab. Then you will find it.


I have seen many dashboard videos but this is easily one of the best. Great work on the video and great excel skills
I am so much glad that you liked it... Thank you so much for your appreciation... ❤️❤️
This one is simple yet one of the best videos about excel dashboards!
Thanks Angken... This comment is giving me a huge motivation to work... Thanks... ❤️
Excellent and Simple video.
Avinsh I am so much glad that you liked our videos... ❤️
Thanks for the wonderful video... means a lot!!
Kindly request you provide files, prepare three financial statements, and create a dashboard... in a continuing process... preparation of statements, creating and presenting in dashboard
I love the yellow color
Good job, ROI in the analysis sheet , how much was calculated based on the previous information like net profit and income?
As everyone knows ROI is net profit over investment cost
Kindly provide us more clarification about this
All the data here is hypothetical. Here I focused on the visualization part rather than the financial part. I try to teach how to present the data more beautiful way. But thanks for you nice input 🙂😀
I wish u millions of followers
Hi Tenzin, Many Many Thanks for supporting me...❤️
This is great work
Thanks...❤️
Thank you, i really needed this
Thanks Jane ❤️
Excelente trabalho. Muito obrigada
Bom ouvir. Obrigado Valéria por sempre apoiar o canal ...
Awesome content. Thanks
Thanks Arung... Keep connected, more are coming... 😊
Very well done sir
Thanks Brent for your comment
I want branch and monthwise data of income and expense.. How should i prepare
Thank you for your content, that was a really great explanation. i have one question how do you connect the link from the drop down list to colomns d30 with google sheet. cause i've tried but it failed. could you please eloberate this. thank you in advance.
I have one question when you applying max formula why you took 125%. can you elaborate please. Thanks.
Just for beautification... nothing else...you can give 100% or anything else 😀
Amazing work
We are glad that you liked our videos.. Thanks Luke! ❤️
Can you tell me if two combo box ie form control be interconnected?? So that if I select any month from any of the combo box, difference can be seen
Loan pay back optimizer format can be available in excel?
Multiple loan repayment plan ? Pl share excel file
Multiple person how can maintenance?
Yes sir... It can be done in excel...we don't have any video in this topic.... We will make one soon... Keep in touch.. 😊
Hey, thank you for amazing work, but I need your help, I'm training now, but I couldn't get same result as yours (6:53mins) could you type that formula please, I wrote same but there's no result
Nigora, If you are using the same data log from my download link, then the formula is: =MAX(D6:O6)*1.25
Still have confusion? feel free to mail us at: Learningx.Tuitorial@gmail.com
@@LearningXOnline thank you 👌
7:16 why multiply with 1.25?
Ultimate bro
Thanks brother 😊
Why you multiplied the incomes by 1.25?
I really didn't understand that. please explain
Just for better visualization... If you multiply it by 1.25. Then the chart data line will not cover fully when the max number of that data set comes for comparison.. So its looks better.....If you want you can give it 1.1 or 1.2 or nothing, or just skip it as the effect is not so high....Not a major fact. 😊😊
@@LearningXOnline can you please elaborate this. I tried reading your explanation but I still can't figure out what you mean. In my excel sheet when I multiply, the data points in the donut chart indicate values higher than the ones on the income statement. Or it doesn't matter because you later use a text box to write down the actual value of the ROI for example.
I multiplied this with 1.25 to show a gap in the donught chart when it's the max value. Example, higher the multiplication number means higher the gap in the donught chart (yellow portion). If you don't multiply, then for max value , donught chart will be fully covered by black portion. It's don't look so good. So I did this. You can skip it. Not a major fact.
@@LearningXOnline well I can simply compare present income with previous one. So I don't have to multiply with 1.5 and the donut chart will also show comparison between two income tables.
I got what you wanted to show..thanks BTW
sir can i made this dashboard and add to my portfolio project?
No issue. But give credit.
Please I can you help me with the index and match formular? I didn't get it
Check out this: ua-cam.com/video/hYQdjx4O5KY/v-deo.html
Can i creat this in 2007
Sir In my excel sheet this kind of chart is not showing
That was not a chart, that was a Shape. Go to insert and shape. Connect the Word with the shape as I have shown in the video.
@@LearningXOnline I was talking about waterfall chart
Ok. It's not available in all versions. Use Ms office 16 or 19 to get it
why you multiply max with 1.25
How i can get data file used in this video
At the end of description box
Sir actually when you link the first text box to ROI I also did the same but mine is got linked but didn't get the same result it's not showing ROI written on it
Make sure the cell you have linked, ROI is written there. If done. Then also check is the font colour in the shape is black. Sometimes it stay white, so you can't see. Make the font black in shape. 🙂
@7:15 Please explain me how you choosed 1.25 % I'm lil confused
Damera thanks for the comment. I have done this for not showing the donut charts to be 100% full. Just for visualization. You can ignore this or you can multiply it with any number. No effect on data, just for visualization. Check other comments, there I did reply too. For more query mail me at: Learningx.Tuitorial@gmail.com
@@LearningXOnline I got you..thanks alot😊
Como puedo obtener el acceso?
Verifique el enlace de descarga en el cuadro de descripción y haga clic en solicitar acceso ... Luego le daré acceso instantáneamente😊
@@LearningXOnline Pero no hay un enlace de descarga en la descripción señor ...
How can download?
Click the download link from the description....I will give you the access soon....😊
@@LearningXOnline But there is no download link...
Shall i know is it feature form control for updated microsoft only? I can't find it in my insert tab😅
Yes Ramil it's available in MS Excel. But you have to enable developer mode from File----> Options-----> Customize Ribbon------> Tick on developer option from the main tab. Then you will find it.
Can i pay in rupee, if ur in india
You can only purchase it from Teespring. Link is in the description box.