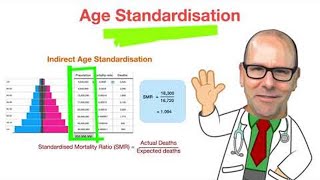
What is STANDARDIZED data?? (Direct and Indirect Standardization)

Вставка
- Опубліковано 26 кві 2020
- See all my videos here www.zstatistics.com/videos
Health Stats IQ series playlist here:
• Health Stats IQ
Regression series here:
• Regression series (10 ...
Descriptive statistics series here:
• Descriptive Statistics...


The mellow music in the background makes your presentation easier and more enjoyable to listen to.
SUPER helpful for my Master's level epidemiology course! Thank you so much!
I second that!
So clear and professional...thank you! This is a terrific supplement to my epidemiology course!
You sir, are truly awesome. Far, far better explained than in my introduction to epidemiology book. Thank you.
Hugely helpful, the explanation and graphics made it really clear. Thank you!
Exactly, similar analysis, me and my wife (statistical) have discussed. Thank you very much for detailed explanation.
Good video, good diagrams. Appreciate your effort ZED. Will be going through the rest of the series.
Hey Justin, your material is just absolute gold. Thank you so much for maintaining and sharing such clear tutorials. Do you use anything besides Excel? I would love to see your concepts applied in a stats workflow, say for example with Python/Pandas or R.
Sooo helpful! Love how you explained it! Thank you!!
You are my hero! Thank you!!! Very helpful for my health & mortality demography class. Thank you thank you thank you!!!
really helped me understand whilst trying to navigate my undergraduate Bachelor Health Science Epidemiology Unit thank you!
You saved me buddy, I cracked an offer letter today. Thanks a lot.
Excellent video, completely answered the questions i had.
Thank you so much, it's very easy and understandable once i watch this video and I love how you explain it. Big thanks!
Clear explanation! Thanks!
Yo, bruh, just got a notification about your new video. Well done. I have a question: In linear regression, have you every experienced a dramatic increase in R2 and errors after standardising the predictor variables? That is happening to me as we speak. Any explanations?
Thank you sooo much for this video. It helped me understand way better for Epidemiology
Stunning stuff!
The best explanation ever!!
Thank you so much.. Iam doing master degree in community medicine in Iraq and this part of epidemiology just made me cry..
I watched your presentation and everything was so clear..
That is a super clear explanation!!!!
Thanks for an amazing video. if you didn't put up this video, i would have believed what media says about kerala vs India.
Cameroon ECID, Hello,
Clear and concise... Thank you
Nicely explained . Thanks
YOU'RE A GENIUS! THANK YOU!!!
Nicely explained!!!!
thanks for making this so much easier to understand compared to how my lecturer explained
Excellent! Very clear explanation with COVID-19 as an example made the talk very contemporary and understandable to all. Thank you.
Super helpful, thanks 😊
Hi Zed,
Thank you for sharing. What do you infer, If the crude mortality rate is less than the Standardised mortality rate?
Nice explanation, this will help my test.
nice explanation
You're amazing!
Thank you!
Thank you!!
Nice example !
Great presentation. How would you go about finding, testing for possible/potential counfounding factors if, e.g., you didn't know of the effects of age in rate of disease?
a bit confused on how exactly you get the mortality rates in the standard population. it will help a newbie like me to understand exactly how you get the mortality rates in the standard population at step 1, although you mention before step 1. Nevertheless, I find this movie very helpful. Additionally, it will help emphasising on when to use the indirect standardisation vs. direct standardisation . I am saying this because indirect standardisation may apply to a dataset that does have low numbers for age group.
Wonder how to identify the cause(s) of the significant difference between groups?
Much appreciated
great video .....
Hi Zed, how do i connect to you? mail or anything. And also in categorical x variables-advanced regression, couldn't understand the dummy variable trap thing. what exactly is it. either of agecat 1 , 2 , 3, 4 can be one. so if we are using all the agecat variables, then only all the data points will be considered in regression right. not clear, can you explain? thaNKS
Thanks
You are my savior
Is it possible to estimate an age adjusted rate when you know the crude rate of death of a whole population and the age distribution of the population, but you don't know the rates of deaths for each age group?
Justin I wish you could start a series about time series ARIMA model!!!
So helpful! I wonder is it possible to use standardization to standardize other rate, such as morbidity rate or hospital admission rate? or is it only specific for standardize mortality rate? and do we always need to standardize every data we read before making interpretation? I really appreciate if you could answer my questions....
Yes possible for any numeric variable
34 years living in Kerala and I just find out that we have a flag. Well explained video. 👍🏻
But when should we use direct standardisation and when should it be indirect?
When the age specific death rates of two or more populations are known, we will go for direct standardisation.
On the other hand , when the age specific rates of the population of interest are unknown , indirect standardisation is to be applied.
Even I am seeing the flag of Kerala for the very first time [mallu here :) ]
It totally clear my confusion.
This is exceptionally useful information. I am curious how it might relate to a mortality rates within a population. For example, in your examples related to COVID, you are evaluating mortality rates for the entire population (there are 5 million people here and 1000 died of COVID19), rather than saying there are 5 million here and 500,000 were diagnosed with COVID19 and of those, 1000 died. How might we account for age distribution with this? Would we still use the "all in" standard population or would our new standard population become just those 500,000 who had COVID19? Thanks in advance!
How would the calculation look like if I wanted to standardise for another variable e.g. male-female-distribution in the comparing countries?
Recommended book for demography and population studies?
Tx sir
Very helpful :')
Where'd you get the intro music from?
What if we want to adjust for multiple factors. For example race and sex along with age. This tabular method would become complex. So how would be deal with that?
Fantastic video! But I think the 1.2 standardized mortality at the end of the video should be compared to India's 1.7 rather than Karala's 2.2. Because you are applying Karala's death rate over to the Indian population, the 1.2 means if India had Karala's rate, India's number would have been 1.2 instead of 1.7.
I think so too.
Hi I'm a demography student from KERALA, India
How would I compare deaths by age from one year to the next? The age groups always stay the same, but my populations grow and deaths grow as well.
minute:8:11 is the calculation correct for pop 2.2 and 7.1? im getting a different answer: 2.2/1000*5,900,000= 12980 and 7.1/1000 *1,400,000= 9,940 . am i doing the math correctly? or am i missing something
I think UA-cam needs to add a feature where, if you downvote a video, you have to state why! I just don't get it.
I have a question, though. In the India example (direct standardization), when computing the standardized rates by age group, isn't Kerala part of the standard population for the rest of India? Wouldn't it have been better to do this computation, **excluding** Kerala?
This is a good tutorial. Please dont post subtitle above the calculations. It's a little uncomfortable. Thanks for the explanation. Tc
Is this the same as normalization?
Why is indirect method not preferred? i.e. comparison after indirect method is not valid
#am_from #kerala
what is the general population? white people? and what are the confounding factors?
I think the general population is everyone, including the test population.
your disclaimer at 13:20 didn't age very well... lol
Yikes. Yeah, they were innocent times.