I have so much respect for how a good explainer you are. This video is amazing. Very clear, structured and most importanty calm (good comfort for ones who find these processes taunting already).
Rather than just using the closing prices, adjusted prices that consider dividends should be used. ATT is low because their dividend of about 5% is being excluded. The adjusted prices are available from Yahoo. Also, the annual return should be compounded and not just the monthly return times 12.
I agree with you to take adjusted prices instead of closing price. Regarding your second remark I disagree since the whole calculation is based on arithmetic returns and not geometric returns, therefore multiplying by 12 is the right approach.
I did my senior project on optimization for my math degree and I tried applying it to my investments. I kept getting stuck and frustrated and your video showcased what my problems were: I didn't have a good objective function (I didn't know about the Sharpe Ratio) and I wasn't using my tool correctly (I didn't know about the Ctrl+shift+enter you had to do for matrix multiplication). Thank you so much for explaining these things, I'm going to try these out as soon as I can.
Thanks alot sir I really appreciate your help with this video, I became successful in the online trading market because I decided to do my homework and not enter the market as a novice Thanks to your mentoring program Mr Romero pieto.
Many thanks to Mr Romero pieto for helping me and my family this year I invested with him with the minimum amount of $20,000 and he profits me $78,000 per week his indeed an heaven sent.
Jessica Vincent Am from Greece 🇬🇷 and am also a newbie in the online Trading market so please how can I get hold of Mr pieto and his trading services ?
Hello, I don't understand for the last formula to calculate y* how dow you decide the A value. There's a range of values based on risk aversion? Thanks
Thanks a lot for the video. I had a couple of questions though. 1. How would this change if you were using daily instead of monthly returns? 2. How would it change if short-selling was allowed vs. if short-selling wasn't allowed? Thanks for the help
After 1 yr here is the reply, 1-it dosent change much, it change for the fact that for the annual return you don’t have to multiply by 12 but for the number of day. 2-if it’s allowed to use negative weights then if in the portfolio there are very low performance stock the weight could be negative, that means that it’s optimal if you short that stock, otherwise if you don’t use negative weight the optimization should say that the optimal weight is 0
There is another, less cumbersome, way to fill in all the Variance/Covariance values which can be done in less than a minute. Might be handy if you have >4 assets/stocks... Go to DATA Select DATA ANALYSIS Select COVARIANCE Fill out the Dialog Box and create the COVARIANCE Matrix COPY & PASTE THE MATRIX with the Headers anywhere in your Sheet COPY the values only from the original matrix PASTE SPECIAL in the new Matrix after selecting the Values only In PASTE SPECIAL select VALUES, SKIP BLANKS, TRANSPOSE and click OK The Matrix should now be completely filled in, but you still have to multiply by 12 Type 12 in an empty cell and COPY it Select all the values in the new matrix Select PASTE SPECIAL Select MULTIPLY and click OK
Roberto Letts there are so many things wrong with this video. Including the returns. You are right, for returns for more than a one year period you want to use the formula ((1+mr)^12-1). The variance needs to be multiplied by the square root of 12, the time ratio because of the assumption of random walk theory and because standard deviation of a portfolio scales disproportionately, i.e it is not additive. Finally, when he multiplies the covariance matrix by 12, I have no idea why or how mathematically that works because it is squared standard deviation. If you take monthly data and run the solver function for covariance it will spit out the correct numbers, but even assuming his logic of “annualizing” them. Take the same stocks and get annual returns. You will not get the monthly variance *12.
@@Stasthagod the return is arithmetic or geometric, it should be approximately acceptable. The writer is right on "variance" multiply 12; if "standard deviation", square root of 12 as a multiplier.
So avg monthly returns being multiplied by 12 and that being the annual is slightly wrong conceptually. For example a avg monthly return of 0.75% across 12 months will yield a return of 9.381% But if you multiply it like you did in your video it comes out to 9.00%. Maybe I'm misunderstanding this but idk if this is just a simple draw back of using this method
Very interesting. Thanks. Can I ask what do you use to develop efficient frontier asset allocation area graphs? Is it possible with Excel or do you use Python or other tool?
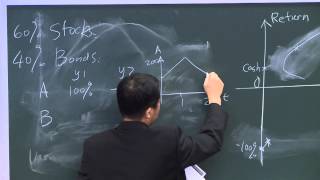
Hello Nemo, the standard deviation of the return of the risk-free asset is 0%. So the complete portfolio (the combination of the risky portfolio and the risk-free portfolio) has a standard deviation of the proportion of the complete portfolio invested in the risky portfolio multiplied by the standard deviation of the risky portfolio. For example, if the standard deviation of the risky portfolio is 20% and 60% of the complete portfolio is invested in the risky portfolio, then the standard deviation of the complete portfolio is 0.2 x .6 = .12=12%. I hope that this answers your question.
@@choyonmazumder3780 Go to DATA Select DATA ANALYSIS Select COVARIANCE Fill out the Dialog Box and create the COVARIANCE Matrix COPY & PASTE THE MATRIX with the Headers anywhere in your Sheet COPY the values only from the original matrix PASTE SPECIAL in the new Matrix after selecting the Values only In PASTE SPECIAL select VALUES, SKIP BLANKS, TRANSPOSE and click OK The Matrix should now be completely filled in, but you still have to multiply by 12 Type 12 in an empty cell and COPY it Select all the values in the new matrix Select PASTE SPECIAL Select MULTIPLY and click OK
That's not uncommon. For my examples, sometimes I have to go through many different companies that will give me weights greater than 0 for all of them. The ones that have 0 weight likely have low or negative returns and/or high volatility and don't improve the risk-return relationship for the portfolio.
Thanks for great video. Risk-free asset is a fixed term in solver for maximisation. So, the weights will be the same for any given risk-free. right? if so, what is the role of risk-free asset factor in your calculations?
Thank you Mr. Dalsem for your amazing video. I have a question, how can we determine the weighted value for each stock? Is that depend on how many fund we invest in?
Thank you for this great video . Question? Checking the box “make unconstrained variables non negative” on solver is to NOT short sell. But if the solver gives you a value of “0” for weights , wouldn’t that mean to short sell? If it’s “0” doesn’t that mean to NOT INVEST into that particular stock ?
Joel Hastings If it shows 0 for weights then it simply means not to invest in it at all. Does not mean to short sell which would be going negative weights.
What is your reccomendation if you had 3000 different stock. Only using the ones on the efficiënt frontier? OR should i only use 4 of the seemingly best ones, also, do i include the Risk free rate?
Does anybody have explanation(link?), how shall this be adjusted to stock prices? Here we sum up relative returns, not taking into account prices of assets, but they are different. Say, 1% return of 100$ stock is obviously bigger than 1% return of 1$ stock.
Shane I'm having trouble with the Expected Return Calculation - I've compiled 40 equity's for the analysis and can't seem to get it to work, could you help me by chance? Trying to do this for some extra credit
i have some problems with the solver... it says that it had found a solution but when i click 'okay' it doesn't change the weights or anything else... and i followed all the stes to use it help :)
I have 1,250 ETF lists from the New York Stock Exchange I need help on how to choose optimal portfolios using cumulative Abnormal return and Behavioral ETFs
Thank you very much. So valuable. Could you please share the data (excel file) for me to practice? I would like to do it on my own and check with your result to make sure I follow your steps appropriately
Thank you so much for video. Can you please advise min period of prices in tabel. You have data from 1/4/2011 up to 1/4/2016. Is it importante to have data for 5 years? Thank you in advance. Have a nice day.
Hi Shane.Nice video. It's very informative. Do you have an updated link for the referenced document? the old link seems to be broken. Or maybe you have the title for the document that I can look it up. Thanks!
This is a great video, but I have one question. From what I understand, the usual range for the risk aversion coefficient (A) is 0-5. However, if I plug in the value of 5 for A, the allocation percentage to a risky asset comes out to 195%! This is the result I get using the values in the video: ER=13.61%, RFR=3%, and SD=10.44%. What am I doing wrong?
Great video!! I have one question: Great video!! I have 12 assets and their prices of 29 different weeks. I want to do portfolio optimization by minimizing the Mean Absolute Deviation. I have calculated r, E[r] , E[r-E[r]] and |E[r-E[r]]| using Excel . What do I have to do next?
Hello Bob, I checked the link and didn't receive the error that you mentioned. I've had a few people access and download the document since you originally sent me an e-mail and did it myself without any problems. Unfortunately, I don't run the website where the document is posted. You might try using a different browser.
@@svandalsem Thanks, Shane. Chrome worked but Opera, Firefox, and Edge all reported an SSL certificate expiration error (46 days) and blocked a purchase. Makes me suspicious of Chrome as It should have done the same. Seems that Plasso has been acquired by another company, perhaps explaining a miscommunication about the site's SSL certificate configuration. If you have a contact at Plasso, you may want to inform them. Also, is the finished Excel doc available? Yes, I am lazy...:-) Thanks again.
I get something like 400% into risky portfolio and -300% into risk free asset. Am I doing something wrong or do I need to borrow all the money and invest it in the risky portfolio with 4x leverage?!
Could you please upload again the document?, I tried to access the document with the link in the description but I can't open it on my browser... I don't know if it's just me or someone else has the same problem... Thank you!
Hello sir In this video you multiply by 12 to make annually. I have a question if I am doing on daily basis I will multiply by 251 or 365 because in our country stock market open 251 days in a year. Regards and Thanks


I have so much respect for how a good explainer you are. This video is amazing. Very clear, structured and most importanty calm (good comfort for ones who find these processes taunting already).
Rather than just using the closing prices, adjusted prices that consider dividends should be used. ATT is low because their dividend of about 5% is being excluded. The adjusted prices are available from Yahoo. Also, the annual return should be compounded and not just the monthly return times 12.
I agree with you to take adjusted prices instead of closing price. Regarding your second remark I disagree since the whole calculation is based on arithmetic returns and not geometric returns, therefore multiplying by 12 is the right approach.
I did my senior project on optimization for my math degree and I tried applying it to my investments. I kept getting stuck and frustrated and your video showcased what my problems were: I didn't have a good objective function (I didn't know about the Sharpe Ratio) and I wasn't using my tool correctly (I didn't know about the Ctrl+shift+enter you had to do for matrix multiplication).
Thank you so much for explaining these things, I'm going to try these out as soon as I can.
Hey Josh! I could you please tell me the title of your project? I am also majoring in math.
I wanted be a professional portfolio manager, this will help me to understand much better
Massive thanks. Seeing how things are done is way easier than trying to understand the formula... at least for me :P
thank you so much sir. This is perfectly explained, this is exactly what i needed.
Hast du zufällig deine Bachelor Arbeit dazu geschrieben?
Thanks alot sir I really appreciate your help with this video, I became successful in the online trading market because I decided to do my homework and not enter the market as a novice Thanks to your mentoring program Mr Romero pieto.
His consistency in profiting his various clientele really amaze me when Trading on their behalf.
Yes in recent times I profit weekly when investing with Mr Romero pieto he indeed trades on my behalf, making me earn much profit every week.
Highly intensive teaching sir.
Many thanks to Mr Romero pieto for helping me and my family this year I invested with him with the minimum amount of $20,000 and he profits me $78,000 per week his indeed an heaven sent.
Jessica Vincent Am from Greece 🇬🇷 and am also a newbie in the online Trading market so please how can I get hold of Mr pieto and his trading services ?
Thank you so much for your explanation! i finally figured out the error that i've been trying to identify for the past few hours 😭
Thank you for that tutoring. I was very confused and now it is much clearer.
Impressive work
Sir i wana,more videos on portfolios risk ans return comparison between stocks
Your method of teaching is very good
Thank you very very much! You just helped me to solve a problem in my article!
Thanks Sir! Such a complete guide for the beginners. Much appreciated.
Hello, I don't understand for the last formula to calculate y* how dow you decide the A value. There's a range of values based on risk aversion? Thanks
Nicely done, very thorough
Thanks a lot for the video. I had a couple of questions though.
1. How would this change if you were using daily instead of monthly returns?
2. How would it change if short-selling was allowed vs. if short-selling wasn't allowed?
Thanks for the help
After 1 yr here is the reply,
1-it dosent change much, it change for the fact that for the annual return you don’t have to multiply by 12 but for the number of day.
2-if it’s allowed to use negative weights then if in the portfolio there are very low performance stock the weight could be negative, that means that it’s optimal if you short that stock, otherwise if you don’t use negative weight the optimization should say that the optimal weight is 0
There is another, less cumbersome, way to fill in all the Variance/Covariance values which can be done in less than a minute. Might be handy if you have >4 assets/stocks...
Go to DATA
Select DATA ANALYSIS
Select COVARIANCE
Fill out the Dialog Box and create the COVARIANCE Matrix
COPY & PASTE THE MATRIX with the Headers anywhere in your Sheet
COPY the values only from the original matrix
PASTE SPECIAL in the new Matrix after selecting the Values only
In PASTE SPECIAL select VALUES, SKIP BLANKS, TRANSPOSE and click OK
The Matrix should now be completely filled in, but you still have to multiply by 12
Type 12 in an empty cell and COPY it
Select all the values in the new matrix
Select PASTE SPECIAL
Select MULTIPLY and click OK
What you just described is population variance, how do you find sample variance?
Thank you very much for your tutorial. it worked nicely for me. Great job !
isnt the correct way to make the monthly return to annual return --> ((1+mr)^12-1) mr=monthly return, same for the variance?
Roberto Letts there are so many things wrong with this video. Including the returns. You are right, for returns for more than a one year period you want to use the formula ((1+mr)^12-1). The variance needs to be multiplied by the square root of 12, the time ratio because of the assumption of random walk theory and because standard deviation of a portfolio scales disproportionately, i.e it is not additive. Finally, when he multiplies the covariance matrix by 12, I have no idea why or how mathematically that works because it is squared standard deviation. If you take monthly data and run the solver function for covariance it will spit out the correct numbers, but even assuming his logic of “annualizing” them. Take the same stocks and get annual returns. You will not get the monthly variance *12.
@@Stasthagod the return is arithmetic or geometric, it should be approximately acceptable. The writer is right on "variance" multiply 12; if "standard deviation", square root of 12 as a multiplier.
Thank you!!! Such a great explanation...
Excellent demonstration thanks.
Why not use LN to calculate monthly return?
Thank you so much!!This is really helpful
That is great and really helpful!!! Thank you soooo much!
Really helpful and concise
Very well explained
How do i calculate my own A (investor risk aversion)?
Amazing video!
This video is very clear!
Huge respect❤
Could someone please provide academic references to the information/ Formulae at the beginning of the video
I just want to let you know that the link to the document given in the description throws 404: Page Not Found
You SAVE my exam!!!!!!!
Very nice work. One question though, what is the range of A (risk aversion)? I mean what does the number 10 stand for?
10 is an indicator for high risk averseness.
It is usually around 2-3 according to a paper I read, and empirically it is around 2.25 from some psychological experiment
@@jujanangelo Yeah so is 10 a percentage value or an absolute unit? Is it like 10% risk averseness?
Great explanation. Could I please have access to the document used in the video as well?
So avg monthly returns being multiplied by 12 and that being the annual is slightly wrong conceptually.
For example a avg monthly return of 0.75% across 12 months will yield a return of 9.381%
But if you multiply it like you did in your video it comes out to 9.00%.
Maybe I'm misunderstanding this but idk if this is just a simple draw back of using this method
Really helpful. Quick question though. What will I need to make different if I want to get the constrained minimum variance portfolio?
well taught , thank you
Great video! Thank you!!!
Very interesting. Thanks. Can I ask what do you use to develop efficient frontier asset allocation area graphs? Is it possible with Excel or do you use Python or other tool?
24:40 How would you calulate the Standard deviation of the proportion portfolio with the risk free asset?
Hello Nemo, the standard deviation of the return of the risk-free asset is 0%. So the complete portfolio (the combination of the risky portfolio and the risk-free portfolio) has a standard deviation of the proportion of the complete portfolio invested in the risky portfolio multiplied by the standard deviation of the risky portfolio. For example, if the standard deviation of the risky portfolio is 20% and 60% of the complete portfolio is invested in the risky portfolio, then the standard deviation of the complete portfolio is 0.2 x .6 = .12=12%. I hope that this answers your question.
Thank you! Helped me out
Superb
Thanks for this helpful video. But why did the produce the co-variance matrix manually? Could have used data analysis...
How Sir? Can you share any link ?
@@choyonmazumder3780 Go to DATA
Select DATA ANALYSIS
Select COVARIANCE
Fill out the Dialog Box and create the COVARIANCE Matrix
COPY & PASTE THE MATRIX with the Headers anywhere in your Sheet
COPY the values only from the original matrix
PASTE SPECIAL in the new Matrix after selecting the Values only
In PASTE SPECIAL select VALUES, SKIP BLANKS, TRANSPOSE and click OK
The Matrix should now be completely filled in, but you still have to multiply by 12
Type 12 in an empty cell and COPY it
Select all the values in the new matrix
Select PASTE SPECIAL
Select MULTIPLY and click OK
excellent work
Question on your investor risk tolerance level. How did you derive the "10" and its relation to the 97% allocation into risky assets?
it was very helpful. Thanks a lot!
It reminds me of my University :)
Mr. Van Dalsem,
You are a weapon mate. Top stuff.
Sincerely,
Some very stupid finance students xo
Hi! I tried with 14 different shares and after using solver, 9 of them were suggested as 0% of the portfolio. Do you know why?
That's not uncommon. For my examples, sometimes I have to go through many different companies that will give me weights greater than 0 for all of them. The ones that have 0 weight likely have low or negative returns and/or high volatility and don't improve the risk-return relationship for the portfolio.
Would you recommend to use Kelly's Criterion for the last shown proportion?
Could you just upload the document to Github? The link is broken.
Hello Jimmy, I've updated the link.
thank you! that's really helpful! :)
great video
very helpful
Well done.
If you do not know the degree of risk aversion, how do you calculate y* to get the optimal weights for the risky and risk free portfolio?
Rule of thumb: 3 or 4
Thanks for great video. Risk-free asset is a fixed term in solver for maximisation. So, the weights will be the same for any given risk-free. right? if so, what is the role of risk-free asset factor in your calculations?
Great video!
Thank you Mr. Dalsem for your amazing video. I have a question, how can we determine the weighted value for each stock? Is that depend on how many fund we invest in?
Thank you for this great video . Question? Checking the box “make unconstrained variables non negative” on solver is to NOT short sell. But if the solver gives you a value of “0” for weights , wouldn’t that mean to short sell? If it’s “0” doesn’t that mean to NOT INVEST into that particular stock ?
Joel Hastings If it shows 0 for weights then it simply means not to invest in it at all. Does not mean to short sell which would be going negative weights.
Very clearly and easily to understand. Could you share your documents (word and excel files) ? Thanks!
Much appreciated.
thanks bro
Much thanks!!!!
What's the range of possible values for A? How do we quantify A? What does "10" mean for instance?
Great
What is your reccomendation if you had 3000 different stock. Only using the ones on the efficiënt frontier? OR should i only use 4 of the seemingly best ones, also, do i include the Risk free rate?
Thanks mate
.
Thank you
Encouraging
.
Could you please send me the word document at the beginning of the video? Would be a big help!
I can't access the document without paying a subscription fee on coursehero. Is there any other way for me to access the full document?
Does anybody have explanation(link?), how shall this be adjusted to stock prices? Here we sum up relative returns, not taking into account prices of assets, but they are different. Say, 1% return of 100$ stock is obviously bigger than 1% return of 1$ stock.
What's the difference between Markowitz portfolio optimization and risk parity portfolio optimization? Is it the same process in Excell for both?
Shane I'm having trouble with the Expected Return Calculation - I've compiled 40 equity's for the analysis and can't seem to get it to work, could you help me by chance? Trying to do this for some extra credit
thank you so much
i have some problems with the solver... it says that it had found a solution but when i click 'okay' it doesn't change the weights or anything else... and i followed all the stes to use it
help :)
How did you get the risk aversion level of 10? what does it actually signify, can you tell me please? only that part is not clear to me.
thanks
I have 1,250 ETF lists from the New York Stock Exchange I need help on how to choose optimal portfolios using cumulative Abnormal return and Behavioral ETFs
Hi, if we have more than 10 assets that are from different industries (i.e. at least 2 stocks in each industry), can we still use this method?
Hi, do you still have that document ? Because that link does not work :). So if I may ask you for update once again :)
Thank you very much. So valuable. Could you please share the data (excel file) for me to practice? I would like to do it on my own and check with your result to make sure I follow your steps appropriately
thank you!
Thank you so much for video. Can you please advise min period of prices in tabel. You have data from 1/4/2011 up to 1/4/2016. Is it importante to have data for 5 years? Thank you in advance. Have a nice day.
Hi Shane.Nice video. It's very informative. Do you have an updated link for the referenced document? the old link seems to be broken. Or maybe you have the title for the document that I can look it up. Thanks!
Updated
One question was the risk free rate give or did you calcilate it
This is a great video, but I have one question. From what I understand, the usual range for the risk aversion coefficient (A) is 0-5. However, if I plug in the value of 5 for A, the allocation percentage to a risky asset comes out to 195%! This is the result I get using the values in the video: ER=13.61%, RFR=3%, and SD=10.44%. What am I doing wrong?
That would be leveraged, and you would short risk free and use those proceeds to invest in risky asset
My solver does not change any of my weights even though it says it found a solution. I’m using excel 2010
Great video!! I have one question: Great video!! I have 12 assets and their prices of 29 different weeks. I want to do portfolio optimization by minimizing the Mean Absolute Deviation. I have calculated r, E[r] , E[r-E[r]] and |E[r-E[r]]| using Excel . What do I have to do next?
Hello Anastasia, I would need to see the worksheet that you are working on to answer that question.
i dont understad at all , inthe matrix is the same company should be 1 right??
Great video.
Just one question.
Does this approach work for a 3 asset portfolio as well?
This approach should work with a minimum of 2 stocks and theoretically above 2 number of stocks.
Should'nt the annual variance be calculated in the following way: 12^12*V(x) ? Thanks for answer
no
@@svandalsem ok, thanks. I was confused.
can anyone explain the matrix notation of the standard of deviation of the portfolio please....
Is this the Modern Portfolio Theory ? And can we create an Efficient Frontier Chart with this ?
You should use geometric mean not arithmetic mean. It would be skewed a lot.
Tried to purchase the offered accompanying documents, but the plasso commercial site is inaccessible because of an expired SSL certificate.
Hello Bob, I checked the link and didn't receive the error that you mentioned. I've had a few people access and download the document since you originally sent me an e-mail and did it myself without any problems. Unfortunately, I don't run the website where the document is posted. You might try using a different browser.
@@svandalsem Thanks, Shane. Chrome worked but Opera, Firefox, and Edge all reported an SSL certificate expiration error (46 days) and blocked a purchase. Makes me suspicious of Chrome as It should have done the same. Seems that Plasso has been acquired by another company, perhaps explaining a miscommunication about the site's SSL certificate configuration. If you have a contact at Plasso, you may want to inform them. Also, is the finished Excel doc available? Yes, I am lazy...:-) Thanks again.
I get something like 400% into risky portfolio and -300% into risk free asset. Am I doing something wrong or do I need to borrow all the money and invest it in the risky portfolio with 4x leverage?!
In Solver you can you can choose to require that the weights all be positive (including 0).
Can you explain one more time about the proportion?
Could you please upload again the document?, I tried to access the document with the link in the description but I can't open it on my browser... I don't know if it's just me or someone else has the same problem... Thank you!
Updated
Could you use CAPM to calculate the expected return?
Hello sir
In this video you multiply by 12 to make annually. I have a question if I am doing on daily basis I will multiply by 251 or 365 because in our country stock market open 251 days in a year.
Regards and Thanks
YOu * by 251
It is super!! Where can i get doc file?