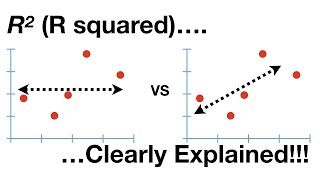
Predictive Analytics: Regression analysis - R-Square and Adjusted R-Square Clearly Explained.

Вставка
- Опубліковано 15 жов 2024
- What are R-Value R-Square and Adjusted R-Square values in Regression Analysis? Predictive Analytics
In this video, I have explained exactly what is R-Value, R-Square and Adjusted R-Square coefficients in Regression analysis in a simple language with an example using SPSS software.


Do you want to do PhD data analysis using Amos in a simple and easy way ? Then, this online course, "Mastering Structural Equation Modeling with Amos: From Fundamentals to Advanced Techniques," is just what you need! This course provide a simple and easy learning experience with practical examples. Visit our website at myeasystatistics.graphy.com to enroll today. Don't miss out this chance to learn everything about SEM using SPSS Amos, from the basics to advanced techniques. Start your journey now!
The adjusted R square explanation is clearer to me now than at any other time. thank you for video
Very good video thanks! Loved the authentic Indian city traffic noises in the background too, made me nostalgic for a country I’ve never been to ❤️
A good 8 mins . Very rare to find explanation videos like this
It's very pleasure to see your videos since it's clear my doubts with full clarification. Thank you once again for your service sir.
Sir, what if negative value get in regression. It meaning ? Sir.
Very easy to understand thank you sir
Thank you very much Sir. I am writing an article for my thesis and I should write a paragraph to interpret the results. It is a linear regression between : balance skills-challenges and flow.
Model Summary
Model R R Square Adjusted R Square Std. Error of the Estimate
1 .455a .207 .200 .53404
a Predictors: (Constant), Balance_challenge_skills
F= 29,31, sig=,000
How should I please interpret this in a coherent paragraph ?
excellent explanation and demonostration sir
Thank you
Great explanation!
Excellent!
very much clear now
What is difference between r squre and adjusted r square in simple language
good day sir, I just wanted to ask if an independent variable is not significant or does not have an explanatory power to the model but when removing it lowers the adjusted r-square what does this imply? so far the reason that i know the reason is because the t-statistic is greater than one. With this information, what can we infer?
Sir you nailed it.
Thanks sir, for the nice explanation
what if the adjust R-squared value remain the same after a new independent variable was added?
It means there is no change in the model or independent variable added is not having any effect in the model
Thank you Sir
nice sir
please provide regular videos
Regular videos means?
@@MyEasyStatistics means daily or weekly upload videos
Ok
👌
👏👏👏👏
👍😊🙏