Matlab Basics: Histograms

Вставка
- Опубліковано 28 чер 2024
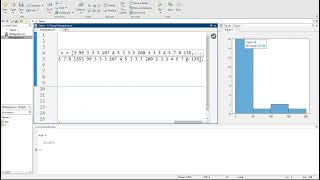
- In this video we go over making and plotting histograms, both with Matlab's new Histogram command and the older hist command. We look at customizing histograms, normalizing histograms and plotting figure with histograms.
Code for this tutorial can be found on our gitHub Repo:
github.com/codinglikemad/Matl...
Read more about histograms at the Matlab documentation:
www.mathworks.com/help/matlab...


Hello! Thanks for the video, I was looking for a way to obtain the values of the histogram and I just couldn't find them until I saw this video. Thanks! I needed the values to do other things.
What I did was:
1. I created a random vector (just to see if the code worked)
2. I calculated the histogram and saved it in a variable "h"
3. I took the values with that command and saved them in another vector and now they are available for use
Be careful with the capital V in values ;)
prueba=rand(10000,1);
h=histogram(prueba,256);
h2=h.Values;
Amazing explanation!!
Hello, great video it helped a lot.
But i have one question, i currently count how many times a letter appears in a text and try to visualize the number they appear in a histogram. But how can i rename the x axis that each bar of the histogram is assigned to a letter?
Hi dello,
I would suggest looking at the documentation for histogram:
www.mathworks.com/help/matlab/ref/matlab.graphics.chart.primitive.histogram.html
What you want to do is plot Categorical data. The right way to do this is shown in an example ("Plot Categorical Histogram"), where you provide the data as a categorical. In your case, each letter would be a different category. I think you can basically just convert the text corpus letter by letter to categorical and it will do the rest for you :)
Hello good evening,
Please let me know how to calculate standard deviation, arithmetic mean and variance of an image
Images are basically arrays, so you do it the same way you would any array. You just need to figure out how you want to deal with the 3 color channels.
whats r-x?
I get the following error when I use histogram(X, 'BinWidth', 7):
Invalid or deleted object.
here is an example running the same code you presented in the video:
>> myHist.morebins();
Invalid or deleted object.
Error in matlab.graphics.chart.primitive.Histogram/morebins
What am I doing wrong? I am running this in Matlab 2017b
The most common way to see this error is if you close the figure window which had the histogram in it. If you keep it open while you adjust the bin count it should just dynamically update the figure. Let me know if it still doesn't work, and thanks for asking :)
@@CodingLikeMad Is there any way to then plot the log of the histogram? I read in various places that the only way to do this would be to use the hist function, but I saw that that function is being decommissioned.
Nevermind, I got it... set(gca, 'Yscale', 'log')
Correct, I was just about to reply! You can set it back with set(gca, 'Yscale', 'linear'), and also use the normal yticks and ylabels to make the spacing to be powers of 10.
@@CodingLikeMad Hopefully this is the last question, but is there a way to save the log data? even after the graph has been closed, so that I can send the log transformed histogram, data, into a function?
I don't know of a perfect way to do what you want, but it depends on exactly what you mean. So you can save the bin values (which will not be in log space), and then use a log10() on them to move them to log space if you want (or just save the values and do what you want with them). This won't save the histogram itself, but you can get the bin values and their positions which let you do most things you might want.
Now it IS possible to save a histogram and restore it, but I don't think you want to do this. It took me some work to figure out, but if you save the FIGURE the histogram is plotted in, and then reload the figure, you can get the original histogram from the Children variable inside the figure. But this is really not the right way to do this. I'm pretty sure you can do everything you want from the bin values.