NOTE: 25:39 I should have (Pfit - Pmean) instead of the other way around. Support StatQuest by buying my book The StatQuest Illustrated Guide to Machine Learning or a Study Guide or Merch!!! statquest.org/statquest-store/
I struggled understanding this topic through a textbook/ professor videos online, and this was just a great explanation. It was like watching this video, made all the pieces finally fit
The trick to read hard books is to completely ignore the over detailed math explanation on a topic you don't understand. Why? Because Math needs to be thorough and in doing so it over complicates. I can't tell you how many times when I was starting, I was struggling to understand an algorithm because I was reading the math of it and then I would ask for help from a teacher or collegue, which would explain to me in ENGLISH, what the algorithm did, then it become obvious and the math too afterwards. In any Computer Science field that shows proofs or uses math to explain concepts, completely ignore it, learn the concept first, the math will follow.
I'm an electrical engineer who wanted to learn about machine learning, and your videos helped me understand all the fundamentals of this field. Thank you so much, sir
wow this make so much sense! I'm pissed why college professors don't teach like this, it was a waste of time to sit in their classes being so confused right from the start. I can't thank you enough for your videos!
Wow...i was searching for this on your channel last week and I was so sad I didnt find it... luckily i still have time to study for the test. Thank you!
Of course! I am the person who is embarrassed on the inside that I don't get the stats terms when thrown around at work, but know that I'm memorized them so know what they are, but really don't understand the "why" or how it all relates. Thank you so much for speaking slowly in your videos, reiterating concepts, sometimes with additional concepts in between, and your humor. It's fun. I'm grateful. @@statquest
Thank you for the great video! Please note that from the second 25:49 the degrees of freedom for the numerator should be (Pfit-Pmean), otherwise it is less than 0.
Thank God i came accross your videos. Making my CFA journey towards statistics less overwhelming by explaining like you are explaining to a 5 year old...pheeewww.
Thank you for making this series of statistic videos. One question please: I want to calculate the least squares growth rate of sales for a company. Would I have "higher quality" growth rate by using quarterly sales (40 pieces of data) vs. annual sales (10 pieces of data). Would the seasonality (Christmas sales higher) affects of quarterly sales and distort the growth rate? Thanks,
It sort of depends on how exactly you want to model and what you want to get out of the model. If you want to take seasonality into account, then you need to fit a periodic function (like a sine function) to your quarterly data. That said, the easiest thing to do would be to start with annual sales and see how useful that is.
This is the best explanation I have ever come accross on Linear Regression. I have a much better intuitive understanding of what the mathematic formulas I was exposed to mean. I do have a question. At 21:42, should the numerator be interpreted as [SS(mean) -SS(fit)]/(Pfit - Pmean) or is it SS(mean) - [SS(fit)/(Pfit - Pmean)] ? The position of the square brackets is not clear to me. Kindly clarify.
Your videos are awesome! Thanks a lot for making complex concepts simpler. It will be helpful if you clearly explained Discrete probability distributions
I have a question, in 5:24 why the variance is calculated dividing by n instead of n-1, I thought all the observed data points are just a sample of a bigger population includes data points which we haven't observed yet. I'm sorry if my English confuse you because it isn't my mother tongue
Cool merch you could probably easily create would be a workbook to pair with your book where we could practice calculating R2 for exemple in different scenarios. That way, everytime you learn a new concept you can practice doing the formulas :) i'd totally buy that 😏 and maybe links to extra videos or explainations on the concepts that are a little harder to comprehend for people that are completely new to this field and a little slow lol(like linear regression 😅)
Thank you for the nice video! I wonder for your explanation to the F curves around 25:53, shouldn't it be (p_{fit} - p_{mean})=1? In addition, would you please provide the link to your video about the degrees of freedom if that is already available?
I don't understand why least squares can cause any term that will make ss(fit) worse to be multiplied by 0. Is it because mean squares differential the equation? 15:20
Your explanations are wonderful. Please just recommend the book should be studied with your videos. Please make videos on chi-Squared distribution, Monte Carlo Simulations and Hypotheses testing. Thanks for your valuable help.
My favorite book to go along with my videos is The StatQuest Illustrated Guide To Machine Learning. You can get it here: statquest.org/statquest-store/
There are two different ways to fit the line to data. The one most commonly used is to simply do the math and solve for the optimal fit (take the derivative with respect to the squared residuals and solve for where it is equal to 0). However, that method only works in this specific situation. A more general method is based on the "rotate the line approach" that I illustrate in this video. To learn more about it (how to rotate the line), see my video on Gradient Descent: ua-cam.com/video/sDv4f4s2SB8/v-deo.html
Great video overall! But I'm a little confused with your description of calculating a p-value for the R^2. Does this mean we are treating R^2 as a random variable itself and looking at its distribution? Because to me it seems like it is the f-statistic that follows an f-distribution, hence we are calculating a p-value for the f-stat, not the R^2 itself, which(correct me if I'm wrong) does not follow any specific distribution. So what exactly is the connection between the R^2 and the f-stat and its corresponding p-value?
this is amazing, thanks a lot @statquest , please can you also do a video of linear mixed models and generalised linear mixed models, there a few videos about them on UA-cam, it would really helpful. Thank you for the good work
This is an excellent video Josh, thank you! I understand all well until you explain about p-value 23:58. So we were using a dataset of mouse size/weight and weight/tail length/body length, but I'm confusing where the 'random dataset' comes from when you calculate p-value. Could you explain a bit further about this please?
The idea is to give you an intuitive sense of what the p-values associated with linear regression represent. So, to start with, we had 9 data points (9 pairs of weight/height measurements) and fitted a line to it and calculated the F value. That is the "observed" F value generated from the original, raw data. Now pair 9 random values for height (and these could be any reasonable values for height that you randomly select) with 9 random values for weight (and these could be any reasonable values for weight). Calculate the F for those pairs of random values and put that in a histogram. Then repeat until we've done that a lot of times and compare the observed F value from the original data to the histogram.
@@statquest Thanks for explaining all. Much appreciate it. So those 'random values' are completely random, just made up within the range of the normal dataset, right? Then when we are calculating F and p values in SPSS or R, do those softwares go through this process? It might be a bit silly questions, hopefully I'm not too far away!
@@gnosmik That's the idea. However, as mentioned at 25:26, in practice, people (and software) just use an F-distribution (which is an equation for a curved line) to calculate the p-value. The idea of using random data is just to give you an intuition of what the curved line created by the F-distribution represents.
Hi josh, while getting to R^2, you give the formula y= (data-mean)^2. This contradicts your StatQuest "Fitting a line to the data", where your formula was "(b-y1)^2+(b-y2)^2+...", meaning "(intersect-data)^2. Now i already understood that by squaring the difference you get the same positive value, so the order doesn't matter for this purpose. Is there another reason why you put it in the order "(data-mean)^2" in this video? Thanks. Love the videos, just watching for fun
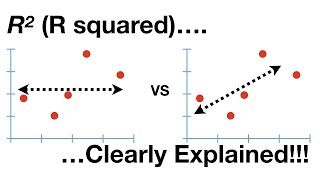
If they were perpendicular, than we would lose the relationship between the variable on the x-axis and the variable on the y-axis, and the whole point is to use an x-axis value to predict a y-axis value. Thus, the residuals are parallel with the y-axis - this preserves the relationship that we want to use to make predictions.
I was always wondering why the model chooses to use R2 rather than absolute value of R, until you draw that polynomial out of all sum of squares. It makes sense now
Question. Why are we calculating R2 value and the p value? Is it the industry standard? Or else What led to the decision that you included it with linear regression. Theoretically Lin reg is complete before that right?(Making concepts clear)
If you just want to fit a line to data, you can used the method of least squares. However, if you want to quantify how well that line fits your data, then you use Linear Regression. Linear Regression consists of using least squares to fit the line to the data and then calculating r^2 and its p-value to evaluate how well that line fits the data.
@@statquest still confused.. as you said 'how well it fits the data', so the r2 and p value are tests for evaluation right? dont they have alternatives? or is it necessary to do exactly these steps. I'll still get a logistic regression model but it may not be the best one without them? Or are you saying that these, or some other alternatives tests are necessary to do, to assess the model and this repeats iteratively until best fit?
@@Slayer1407-d9d They do have alternatives, so, as you say, you might think of r^2 and its corresponding p-values as the 'industry standards'. Pretty much every program that offers a linear regression function will give you those as outputs. However, there are alternatives, and you can read more about them here: developer.nvidia.com/blog/a-comprehensive-overview-of-regression-evaluation-metrics/ among other places.
is residual the difference between the observed value of the dependent variable and the predicted value or the difference between the overall mean of the dependent and the observed value
Hello, I had one doubt. For calculating multiple F values, are we taking random samples from our original dataset itself? As in, if there are 100 data points in total, we will take 80, 70 and any random data points from 100 to plot F values on histogram? Could you please help me with this?
The example where we use random data is just an example of the concepts behind how the p-value is calculated. In practice, we use a curve generated by the F distribution (see 25:26) that represents what would happen if we had generated an infinite number of random datasets.
@@statquest R^2 is just a metric right, and I can set the coefficients of independent variables in such a way that variance(error) exceeds variance(y),( as variance(error) = variance(y* - y), (where y* is the infered value, and y is the actual value) , I can always make y*-y infinitely high for one datapoint, by choosing appropriate coefficients ), or am I wrong? Please correct me.
@@mathematics6199 Yes, in theory, you can do that - but that's not linear regression. In linear regression we don't just set the coefficients to whatever we want. We set them so that they minimize the sum of the squared residuals. And this is why R^2 isn't negative in this context. However, in other contexts, where you can do whatever you want, yes, it can be negative.
If the end of this video doesn't answer your question satisfactorily, please see: ua-cam.com/video/vemZtEM63GY/v-deo.html and ua-cam.com/video/JQc3yx0-Q9E/v-deo.html
This video attempts to explain the concepts behind how linear regression works. However, you don't actually do these things in practice. In practice you use a program, like R, to do it for you. For details, see: ua-cam.com/video/u1cc1r_Y7M0/v-deo.html
I have contacted UA-cam about this problem, but, unfortunately, they are all on vacation until next week. :( The good news is that this video does a pretty good job summarizing the concepts in that other video.
They are the same. However, I changed notation so that I could specify when which model we were using to make the predictions. SS(fit) is the RSS around the fitted line and the SS(mean) is the RSS around the mean.
Awesome, but can we do this without squaring? Why can't we just sum the residuals without any squaring, it looks like it should give us the sum of all distances and then we could plot it in the same way and pick the rotation that gives us the least sum of non-squared residuals and it should still work, curious why do we choose to square it, thank you so much for the video
If the "distances" below the line are negative, they will cancel out the ones above them, so that's a problem. However, we could then take the absolute value so that everything is positive. This could work if Linear Regression was actually solved the way I've presented it here. However, in practice, when you square the distances, you can solve for the optimal parameters directly by taking the derivative of the squared residuals with respect to each parameter, setting those derivatives equal to 0 and then solving for the parameter values.
hello i love watcing your video they are entertaining and educaional but i saw some other videos of ways to determine intercept and slope of a line im wondering if you have a video about that or is there a better approach ?
There are a number of ways to do it. One is to use an analytical solution. Take the derivatives of the equation with respect to the different variables (in this case, the slope and the intercept) and then solve for when those derivatives are equal to 0. For linear regression, this is a fine way to solve the problem, but it only works in this one case. A more general solution is to use something called Gradient Descent. This works on regression problems and many, many more. For details about Gradient Descent, see: ua-cam.com/video/sDv4f4s2SB8/v-deo.html
This is implementation of Linear regression from scratch in NumPy only. In-depth explanation of key concepts like Cost Function and Gradient Descent ua-cam.com/video/wxCQxZKo4hU/v-deo.html


![Lp. Сердце Вселенной #60 РОЖДЕНИЕ ЛОЛОЛОШКИ [Финал] • Майнкрафт](http://i.ytimg.com/vi/YoR0pAV9FVQ/mqdefault.jpg)

NOTE: 25:39 I should have (Pfit - Pmean) instead of the other way around.
Support StatQuest by buying my book The StatQuest Illustrated Guide to Machine Learning or a Study Guide or Merch!!! statquest.org/statquest-store/
I struggled understanding this topic through a textbook/ professor videos online, and this was just a great explanation. It was like watching this video, made all the pieces finally fit
Hooray! :)
Yo bruh seriously I don't understand anything 😭😞
The trick to read hard books is to completely ignore the over detailed math explanation on a topic you don't understand. Why? Because Math needs to be thorough and in doing so it over complicates. I can't tell you how many times when I was starting, I was struggling to understand an algorithm because I was reading the math of it and then I would ask for help from a teacher or collegue, which would explain to me in ENGLISH, what the algorithm did, then it become obvious and the math too afterwards. In any Computer Science field that shows proofs or uses math to explain concepts, completely ignore it, learn the concept first, the math will follow.
I'm an electrical engineer who wanted to learn about machine learning, and your videos helped me understand all the fundamentals of this field. Thank you so much, sir
Happy to help! :)
This assisted me in delivering a presentation for a job interview -- landed the opportunity.
Thanks!
TRIPLE BAM!!! Congratulations!!! :)
I wish I had your lecture 50 yrs ago.... never too late learning it again today. thank you
Thanks!
I struggle understanding this topic but it is Great to learn from someone who can explain things in a simple manner with eloquence
Thanks!
@@statquest Agreed. You articulate well and make the subject simple and easy to understand.
I'm in my stats class but watching this instead of listening to my professor lol 💀
bam!
Double bam!
Ternary Bam!!!
Qudary bam!!!!
Penta bam!
wow this make so much sense! I'm pissed why college professors don't teach like this, it was a waste of time to sit in their classes being so confused right from the start. I can't thank you enough for your videos!
Thank you!
Wow...i was searching for this on your channel last week and I was so sad I didnt find it... luckily i still have time to study for the test. Thank you!
Good luck! :)
Love the musical introduction. Such a nice touch to prime you beforehand :)
Thank you!
Thanks Josh, your channel is recommended from Murdoch University,Australia lecturers. Worth watching your channel
Thanks!
I would be lost without this channel
bam! :)
Great work! The graphics made it super easy to understand.
Glad it helped!
10QUVM for your valuable presentation!!! You made me feel proud in my STAT!!!
BAM! :)
Thanks!
BAM!!! Thank you so much for supporting StatQuest!!!
Of course! I am the person who is embarrassed on the inside that I don't get the stats terms when thrown around at work, but know that I'm memorized them so know what they are, but really don't understand the "why" or how it all relates. Thank you so much for speaking slowly in your videos, reiterating concepts, sometimes with additional concepts in between, and your humor. It's fun. I'm grateful. @@statquest
thank you friendly folks of the genetics departement of NC Chapel Hill , greetings from Paris France.
Thank you!
Thank you Josh! You are truly helping me with the difficult reviewers' comments🤣.
Good luck!
I had to buy a study guide book after watching this video...! This is a great video!!
Thank you so much for your support!
You are indeed a God among mortals. And as such you shall be praised. Tons of gratitude for blessing us with your pristine insight Father Majesty.
Wow, thank you!
Never forget to hit a like to the videos of this channel. It's totally worth it.
Bam!
literally top notch i have ever seen.
thanks man
Thank you!
This was truly advanced concept for me !!! :)
You can do it! :)
I always have a good time with Statquest :3
bam!
Does n equals to the number of data points in F equation? For example, we should take 9 for n in 22:40 ?
Yes
this is just brilliant work!! thank you very much and pls continue teaching :)
Thank you! Will do!
Thank you for the great video! Please note that from the second 25:49 the degrees of freedom for the numerator should be (Pfit-Pmean), otherwise it is less than 0.
Thanks! In theory UA-cam is supposed to alert people of that typo, but maybe it doesn't always work. (I just tried it and it worked for me).
Awesome video, thank you Prof. Josh!!!!!
Thank you!
Thank God i came accross your videos. Making my CFA journey towards statistics less overwhelming by explaining like you are explaining to a 5 year old...pheeewww.
You got this!
Hats off to StatQuest!!!
Thank you!
I am enjoying this teaching method 😍
Thank you!
I got pregnant two times while learning SGD from you. This is the hundredth time i'm jumping from a video to another video.
ok
@26:21 Should the curves say ( P fit- P mean)=1 ?
Yes! That's funny that it's been like that forever, but you finally caught it. Thanks!
@@statquest Haha the credit goes to you for teaching the concepts so well to a newbie! BAM! 😁
Thank you for making this series of statistic videos. One question please: I want to calculate the least squares growth rate of sales for a company. Would I have "higher quality" growth rate by using quarterly sales (40 pieces of data) vs. annual sales (10 pieces of data). Would the seasonality (Christmas sales higher) affects of quarterly sales and distort the growth rate? Thanks,
It sort of depends on how exactly you want to model and what you want to get out of the model. If you want to take seasonality into account, then you need to fit a periodic function (like a sine function) to your quarterly data. That said, the easiest thing to do would be to start with annual sales and see how useful that is.
@@statquest Thank you so much for taking the time to answer my question!
At 15:15, how does least squares cause any useless variable to be multiplied by 0? I thought Lasso regression excludes variables.
Least squares can do it in principle, but not very well. Lasso is much more effective, and lasso also works when there are more variables than data.
Awesome channel! I just bought your book too!
TRIPLE BAM!!! Thank you very much for supporting StatQuest!!!
Thank you. Wonderfully explained!!
Glad it was helpful!
This is the best explanation I have ever come accross on Linear Regression. I have a much better intuitive understanding of what the mathematic formulas I was exposed to mean. I do have a question. At 21:42, should the numerator be interpreted as [SS(mean) -SS(fit)]/(Pfit - Pmean) or is it SS(mean) - [SS(fit)/(Pfit - Pmean)] ? The position of the square brackets is not clear to me. Kindly clarify.
It's the former. It should be [SS(mean) -SS(fit)]/(Pfit - Pmean)
Your videos are awesome! Thanks a lot for making complex concepts simpler. It will be helpful if you clearly explained Discrete probability distributions
I cover the binomial here: ua-cam.com/video/J8jNoF-K8E8/v-deo.html
Hi there, is there a playlist compiling a list of videos of yours relating to machine learning?
Yes, you can find everything (including playlists) here: statquest.org/video-index/
I have a question, in 5:24 why the variance is calculated dividing by n instead of n-1, I thought all the observed data points are just a sample of a bigger population includes data points which we haven't observed yet. I'm sorry if my English confuse you because it isn't my mother tongue
In this context, the way we use variation means that denominator will cancel out, so it really doesn't matter which one (n or n-1) we use.
Best explanation ❤
Thanks a lot 😊!
Cool merch you could probably easily create would be a workbook to pair with your book where we could practice calculating R2 for exemple in different scenarios. That way, everytime you learn a new concept you can practice doing the formulas :) i'd totally buy that 😏 and maybe links to extra videos or explainations on the concepts that are a little harder to comprehend for people that are completely new to this field and a little slow lol(like linear regression 😅)
That's a great idea!
Thank you so much Josh !
Thanks!
Thank you for the nice video! I wonder for your explanation to the F curves around 25:53, shouldn't it be (p_{fit} - p_{mean})=1? In addition, would you please provide the link to your video about the degrees of freedom if that is already available?
Yes, that is a typo. And, unfortunately, I haven't made the degrees of freedom video yet. However, it's still on the todo list.
@@statquest Thank you! I look foreward to your new ones
@@statquest looking forward to the degrees of freedom video too!
I don't understand why least squares can cause any term that will make ss(fit) worse to be multiplied by 0. Is it because mean squares differential the equation?
15:20
or is it because things like ridge regression can shrink the coefficients to 0?
Least squares minimizes the sum of the squared residuals and if setting a parameter = 0 reduces the SSR, then that's what will happen.
Your explanations are wonderful. Please just recommend the book should be studied with your videos. Please make videos on chi-Squared distribution, Monte Carlo Simulations and Hypotheses testing.
Thanks for your valuable help.
My favorite book to go along with my videos is The StatQuest Illustrated Guide To Machine Learning. You can get it here: statquest.org/statquest-store/
Around which point do we rotate the line ????????
Beautiful lecture..really easy to understand
There are two different ways to fit the line to data. The one most commonly used is to simply do the math and solve for the optimal fit (take the derivative with respect to the squared residuals and solve for where it is equal to 0). However, that method only works in this specific situation. A more general method is based on the "rotate the line approach" that I illustrate in this video. To learn more about it (how to rotate the line), see my video on Gradient Descent: ua-cam.com/video/sDv4f4s2SB8/v-deo.html
Great video overall! But I'm a little confused with your description of calculating a p-value for the R^2. Does this mean we are treating R^2 as a random variable itself and looking at its distribution? Because to me it seems like it is the f-statistic that follows an f-distribution, hence we are calculating a p-value for the f-stat, not the R^2 itself, which(correct me if I'm wrong) does not follow any specific distribution. So what exactly is the connection between the R^2 and the f-stat and its corresponding p-value?
The f-statistic is what we use to calculate the p-value for the r-squared.
this is amazing, thanks a lot @statquest , please can you also do a video of linear mixed models and generalised linear mixed models, there a few videos about them on UA-cam, it would really helpful. Thank you for the good work
I'll keep those topics in mind.
Cheer~~~arranged in or extending along a straight or nearly straight line.😊
double :)
This is an excellent video Josh, thank you! I understand all well until you explain about p-value 23:58. So we were using a dataset of mouse size/weight and weight/tail length/body length, but I'm confusing where the 'random dataset' comes from when you calculate p-value. Could you explain a bit further about this please?
The idea is to give you an intuitive sense of what the p-values associated with linear regression represent. So, to start with, we had 9 data points (9 pairs of weight/height measurements) and fitted a line to it and calculated the F value. That is the "observed" F value generated from the original, raw data. Now pair 9 random values for height (and these could be any reasonable values for height that you randomly select) with 9 random values for weight (and these could be any reasonable values for weight). Calculate the F for those pairs of random values and put that in a histogram. Then repeat until we've done that a lot of times and compare the observed F value from the original data to the histogram.
@@statquest Thanks for explaining all. Much appreciate it. So those 'random values' are completely random, just made up within the range of the normal dataset, right? Then when we are calculating F and p values in SPSS or R, do those softwares go through this process? It might be a bit silly questions, hopefully I'm not too far away!
@@gnosmik That's the idea. However, as mentioned at 25:26, in practice, people (and software) just use an F-distribution (which is an equation for a curved line) to calculate the p-value. The idea of using random data is just to give you an intuition of what the curved line created by the F-distribution represents.
@@statquest Excellent! Thanks Josh
Hi josh, while getting to R^2, you give the formula y= (data-mean)^2. This contradicts your StatQuest "Fitting a line to the data", where your formula was "(b-y1)^2+(b-y2)^2+...", meaning "(intersect-data)^2. Now i already understood that by squaring the difference you get the same positive value, so the order doesn't matter for this purpose. Is there another reason why you put it in the order "(data-mean)^2" in this video?
Thanks. Love the videos, just watching for fun
Since order doesn't matter, it's hard for me to remember to be consistent.
Okay great, just was wondering if i was missing something here @@statquest
Amazing explanation
Thanks!
Hi Josh,
Very nice video!
Shouldn't the distances from the points to the line be a perpendicular?
If they were perpendicular, than we would lose the relationship between the variable on the x-axis and the variable on the y-axis, and the whole point is to use an x-axis value to predict a y-axis value. Thus, the residuals are parallel with the y-axis - this preserves the relationship that we want to use to make predictions.
What is the value n (that was mentioned while explaining the degrees of freedom)?
n = the number of data points in the graph.
I was always wondering why the model chooses to use R2 rather than absolute value of R, until you draw that polynomial out of all sum of squares. It makes sense now
Hooray!
Thanks Josh Starmer
Bam! :)
Thanks for the video. Could you please explain more why SS(fit)/(n-pfit) instead of n here 22:48? Thanks a lot.
This has to do with "degrees of freedom" and one day I hope to cover that topic in full.
@@statquest Looking forward to the degrees of freedom video! Parameters have always been a confusing topic for me
absolute masterpiece
Thank you!
Thank you so much for this video
Happy to help!
Question. Why are we calculating R2 value and the p value? Is it the industry standard? Or else What led to the decision that you included it with linear regression. Theoretically Lin reg is complete before that right?(Making concepts clear)
If you just want to fit a line to data, you can used the method of least squares. However, if you want to quantify how well that line fits your data, then you use Linear Regression. Linear Regression consists of using least squares to fit the line to the data and then calculating r^2 and its p-value to evaluate how well that line fits the data.
@@statquest still confused.. as you said 'how well it fits the data', so the r2 and p value are tests for evaluation right? dont they have alternatives? or is it necessary to do exactly these steps. I'll still get a logistic regression model but it may not be the best one without them?
Or are you saying that these, or some other alternatives tests are necessary to do, to assess the model and this repeats iteratively until best fit?
@@Slayer1407-d9d They do have alternatives, so, as you say, you might think of r^2 and its corresponding p-values as the 'industry standards'. Pretty much every program that offers a linear regression function will give you those as outputs. However, there are alternatives, and you can read more about them here: developer.nvidia.com/blog/a-comprehensive-overview-of-regression-evaluation-metrics/ among other places.
@@statquest Thanks a lot for clearing that
insanely good video
Thank you! :)
thank you. that was very clear
Thanks!
is residual the difference between the observed value of the dependent variable and the predicted value or the difference between the overall mean of the dependent and the observed value
The residual is the difference between the observed and predicted values.
Hello, I had one doubt. For calculating multiple F values, are we taking random samples from our original dataset itself? As in, if there are 100 data points in total, we will take 80, 70 and any random data points from 100 to plot F values on histogram? Could you please help me with this?
The example where we use random data is just an example of the concepts behind how the p-value is calculated. In practice, we use a curve generated by the F distribution (see 25:26) that represents what would happen if we had generated an infinite number of random datasets.
Very helpful. Thank you
Thanks!
Hey hi, R squared can be negative as well right?
Not in the context of linear regression. In other contexts, though, it can be.
@@statquest R^2 is just a metric right, and I can set the coefficients of independent variables in such a way that variance(error) exceeds variance(y),( as variance(error) = variance(y* - y), (where y* is the infered value, and y is the actual value) , I can always make y*-y infinitely high for one datapoint, by choosing appropriate coefficients ), or am I wrong? Please correct me.
@@mathematics6199 Yes, in theory, you can do that - but that's not linear regression. In linear regression we don't just set the coefficients to whatever we want. We set them so that they minimize the sum of the squared residuals. And this is why R^2 isn't negative in this context. However, in other contexts, where you can do whatever you want, yes, it can be negative.
@@statquest Thank you so much.
If you could please make a video on assumptions of linear regression, that would be helpful.
I'll keep that in mind.
Great! Thank you!
Thanks!
Not that it matters here but the shouldn't the sample variance formula have n-1 instead of n?
In this case it doesn't matter.
Why was the original Linear Regression video removed for this one? Is the information of this more accurate or clearer?
Without telling me, UA-cam put the original video behind a paywall, so re-uploaded it so it would still be free
u just earned a subcriber
bam! :)
thank you for this
Thanks!
Thank you ever so much!
You're very welcome!
why p value needs to be small?
pls answer
If the end of this video doesn't answer your question satisfactorily, please see: ua-cam.com/video/vemZtEM63GY/v-deo.html and ua-cam.com/video/JQc3yx0-Q9E/v-deo.html
18:30 Is F the F distribution?
Yes
Very nice, thank you
:)
thanks for the video
You're welcome!
That was a really mice explanation.. Thank you!
Ha! Nice one! :)
🌹😄
you are a genius!
Thanks!
I'm so confused. Am i supposed to draw the squares? Where are the squares? I need help 😢. I'm never going to pass this class.
This video attempts to explain the concepts behind how linear regression works. However, you don't actually do these things in practice. In practice you use a program, like R, to do it for you. For details, see: ua-cam.com/video/u1cc1r_Y7M0/v-deo.html
so is mouse size a confounder?
What time point, minutes and seconds, are you asking about?
I am not able to find the video 'Fitting a line to the data'
I have contacted UA-cam about this problem, but, unfortunately, they are all on vacation until next week. :( The good news is that this video does a pretty good job summarizing the concepts in that other video.
what's the difference between RSS and SS(fit) ?
They are the same. However, I changed notation so that I could specify when which model we were using to make the predictions. SS(fit) is the RSS around the fitted line and the SS(mean) is the RSS around the mean.
so is R square , a correlation coefficient?
It is the square of the correlation coefficient.
Awesome, but can we do this without squaring? Why can't we just sum the residuals without any squaring, it looks like it should give us the sum of all distances and then we could plot it in the same way and pick the rotation that gives us the least sum of non-squared residuals and it should still work, curious why do we choose to square it, thank you so much for the video
If the "distances" below the line are negative, they will cancel out the ones above them, so that's a problem. However, we could then take the absolute value so that everything is positive. This could work if Linear Regression was actually solved the way I've presented it here. However, in practice, when you square the distances, you can solve for the optimal parameters directly by taking the derivative of the squared residuals with respect to each parameter, setting those derivatives equal to 0 and then solving for the parameter values.
@@statquest Thank you so much , it makes sense now
This is great
Thanks!
how do you come with the equation
What time point, minutes and seconds, are you asking about?
i had to like just because of the song
bam! :)
hello i love watcing your video they are entertaining and educaional but i saw some other videos of ways to determine intercept and slope of a line
im wondering if you have a video about that or is there a better approach ?
There are a number of ways to do it. One is to use an analytical solution. Take the derivatives of the equation with respect to the different variables (in this case, the slope and the intercept) and then solve for when those derivatives are equal to 0. For linear regression, this is a fine way to solve the problem, but it only works in this one case. A more general solution is to use something called Gradient Descent. This works on regression problems and many, many more. For details about Gradient Descent, see: ua-cam.com/video/sDv4f4s2SB8/v-deo.html
@@statquest thanks man have ag reat day
can you do Quantile Regression?
I'll keep that in mind.
Thank you :)
You're welcome!
I am going to statquest Isle!~
The greatest island on earth!
Bam!!
its like years since u uploaded this
I know! This one is classic! It might even be "pre BAM!"
This is implementation of Linear regression from scratch in NumPy only. In-depth explanation of key concepts like Cost Function and Gradient Descent
ua-cam.com/video/wxCQxZKo4hU/v-deo.html
this is fucking fantastic
:)
Legend
Thanks!
I think at ua-cam.com/video/7ArmBVF2dCs/v-deo.html the slide meant to say (SS(mean) - SS(fit))/(p_fit - p_mean) for the numerator?
Yep
it was great at first and then i lost track after 19 minute mark
Sorry to hear that
awesoommeeeeee!
Thanks!