How to draw a best fit graph in Physics Practical : Every details of a graph

Вставка
- Опубліковано 21 сер 2024
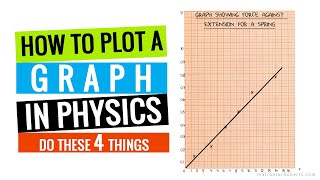
- A Graph is a line straight or curved, that shows realtaion between two quantities out of which one varies as a result of change in other. Graph is a very powerful method of presenting the information between two quantities, it is easier to read and interpret information than tables.
A line of best fit is a straight line drawn through the maximum number of points on a scatter plot balancing about an equal number of points above and below the line.
![How to make Graph - [Part 1] Physics Practical (Finding Intercept) [Hindi/Urdu]](http://i.ytimg.com/vi/zZOFASyH_Qk/mqdefault.jpg)
![How to make Graph - [Part 1] Physics Practical (Finding Intercept) [Hindi/Urdu]](/img/tr.png)


![Дон ДОН, Алаудинов и СБЕЖАВШИЕ из под Курска ахматовцы 😁 [Пародия]](http://i.ytimg.com/vi/dEfCf5IK26Q/mqdefault.jpg)

thank you soooo muchh, i have been struggling with this throughout my entire school life and didn't find any UA-cam channel which explains this. thanksss a lottt sir!❤
This is the best video for learning graph..I always refer back to this one whenever I need to
Sir .. khub valo hoye6e ...asa kori sobar jonno khub helpful 🤗
Sir , ami ei video tai khujchilam , 😭❤️❤️❤️ , thanks
Best video
❤️
Thank you very much 🤗
Thanks🤗
Thanks sir 🙏
Thanks brother 😊
Thanks
Thank you very much
Thank you 😊
You're welcome.
it was helpful but it would've been more effective if it was in your own language.anyway thank u sir.
If % error is 8 % us there any problem
No need to calculate % error here.