Bar Chart Race Animation Using Matplotlib In Python | Matplotlib Tutorial

Вставка
- Опубліковано 14 жов 2024
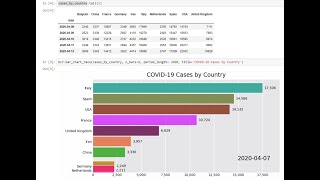
- A bar chart race, also known as a bar chart animation or a bar chart race animation, is a data visualization technique that shows how the ranking of categories changes over time using animated bars. In this video tutorial, we will learn how to create a bar chart race animation using Matplotlib in Python.
📑 Dataset Link: raw.githubuser...
► Buy Me a Coffee? Your support is much appreciated!
-------------------------------------------------------------------------------------------
☕ Paypal: www.paypal.me/...
☕ Venmo: @Jie-Jenn
💸 Join Robinhood with my link and we'll both get a free stock: bit.ly/3iWr7LC
► Support my channel so I can continue making free contents
---------------------------------------------------------------------------------------------------------------
🛒 By shopping on Amazon → amzn.to/2JkGeMD
👩💻 Follow me on Linked: / jiejenn
🌳 Becoming a Patreon supporter: / jiejenn
✉️ Business Inquiring: UA-cam@LearnDataAnalysis.org
#matplotlib #visualization #python


![Animating Plots In Python Using MatplotLib [Python Tutorial]](http://i.ytimg.com/vi/bNbN9yoEOdU/mqdefault.jpg)


awesome
👍
Yes, thank you :D
great thanks a lot
This didn't work for me
okay.