My goodness, this video is so complete, and clearly explained with details of the script... Thank you so very much... 100 points to you...!! You have a new fan...
This is an excellent tutorial -- well presented and thorough. I followed along with my own application example (country healthcare per capita expenditure versus infant mortality rates of various types) and got very interesting results.
Excellent explanation and code. I took the Johns Hopkins data science course, and clustering was part of the course. This video really helps explain the concept.
Great tutorial! You are really helping a lot of people like me, and the best part is- drama, background music etc are completely missing unlike many other tutorials. Also saw some bhojpuri songs :)...thank you sir!
This is truly an excellent, clear and concise tutorial. You covered a lot of topics in a short amount of time. I will be watching your other videos. Well done!
Hi Bharatendra, great video - really helpful! Everything goes well until the point of doing the scree plot, I am getting: > withinGroupSumOfSquares = (nrow(normNum)-1) * sum(apply(normNum, 2, var, na.rm=TRUE)) > for(i in 2:20) withinGroupSumOfSquares[i] = sum(kmeans(normNum, centers=i)$withinss) Error in do_one(nmeth) : NA/NaN/Inf in foreign function call (arg 1) > plot(1:20, withinGroupSumOfSquares, type="b", xlab = "Number of Clusters", ylab = "Within group SS") Error in xy.coords(x, y, xlabel, ylabel, log) : 'x' and 'y' lengths differ Can you help me? Thank you.
+Jonathan Rhein Not sure what's causing the error you got. May have something to do with data. I ran my data using the code you have, and everything seems fine.
Thanks for such wonderful explanation. By the way, I was working on a similar dataset, and apply didnt work for me. Although I removed all character vectors, but still the numeric vectors were returning 'NA'. I applied sapply and it solved the purpose. Thanks again!!
Very Informative, great slides and explanations. The delivery and presentation was good. I will be viewing other videos produced by Edureka. Some suggestions, show more examples. Present the limitations and god fit scenarios for K-means clustering.
dear professor, I am so lucky to know you. could you also update full tutorial about using rmd and advanced model like hmm? Thank you and wish you have a great day
One suggestion to improve the video - When you click buttons and such please can you do it slowly so people can see where you click. Also perhaps consider using a highlight icon for your mouse? I had to watch 4 times before I realised you had pressed the 'run' button in the middle.
Hi Mr. Rai, great tutorial. Thanks for your effort. Just wanted to understand more about these 2 methodologies. Why and when we apply different methodologies i.e. K means and Hierarchy. It will be great help if you can make separate videos for the same. Also, as lots of people requested for data set and you have already uploaded to Dropbox, could you please share the link in your description for everyone's benefits. Thanks again :)
Initially we try all methods and finally choose the one that seems more meaningful for the dataset used. It's difficult to say which method will work best beforehand. Also thanks for your feedback and suggestions.
Thanks Bharatendra. Can you please upload video of how to performe clustering when the dataset has numbers of numerical attributes and categorical attributes. In this video you are eliminating categorical attribute. What would you have done if your dataset has 10 numeric columns and 8 categorical data. Appreciate your knowledge contribution.
+Tushar Lapani For cluster analysis you must have quantitative variables. You can use categorical variables after cluster analysis to see if they show any pattern with identified clusters and use it for characterizing the clusters.
@@bkrai oh right, thanks alot! Can you also tell how do we deal with gender variable for clustering? What im doing is mutating a new var thats 1 and 0 instead of male and female. I then convert that to numeric variable. And then i do the usual process. Is this correct?
Nice and informative tutorial sir. I am performing hierarchical clustering on my dataset with 10 variables and 200 observations. But the output is not very interpretable. Please suggest how can I make it more interpretable. Thanks.
You can explore other clustering methods and if they provide better insights. Here is the link: ua-cam.com/play/PL34t5iLfZddvMPAl1TzHJ_GjQcD3s6w_Z.html
Thank you so much for the tutorial. It is extremely helpful. But my question like the other is that it would have been very kind of you if you would have linked your data set too. Thanks!
Thank you so much for your amazing videos, everything is so clear and practical :) From a french research in cognitive science, I have one tricky question for you : i would like to find the best classifier/cluster analysis for repeated measures dataset (i.e., multiple repeated measures for one subject on the same features, as this is the case in experimental psychology research for example, or in longitudinal studies). Best
Thanks for the informative video. May I please know how to deal with dichotomous variables along with continuous variables in the data if we want to include both in one cluster analysis, how do we do it please?
Dear Sir..thank you for the time & effort that you have put in to make this wonderful video tutorial. I have a query. At 12:27 , how are the original average values displayed even though member.c is used which is obtained through a series of calculations using the normalised data? Why did not you use PCA to decide the no. of clusters for kmeans? Regards Aniruddh
In the 2nd aggregation line, note that I've used utilities. That's the reason we can display original values. In the 1st aggregation, z was used. Also, here focus was on clustering, so pca is not used.
Thank you so much! Very well explained. I would like to ask you if I still can use the Euclidian distance to find the closest elements of a cluster center, even if I use a dimensionality reduction approach (such as PCA, T-sne) that uses probabilities to arrange clusters in 2 dimension before using K-means.
Not yet, but I'm adding this to my list for future. For clustering related videos, you may refer to this link: ua-cam.com/play/PL34t5iLfZddvMPAl1TzHJ_GjQcD3s6w_Z.html
Thank you very much sir. Question: using Within group SS plot (min 14:39), isn't the optimal number of clusters 5? the variability from 4 to 5 seems very significant. Please let me know.
This data has only 22 companies. As we increase number of clusters, number of companies in some clusters becomes really small, to the extent that a cluster may contain just one company. So the choice of 'k' should also consider this aspect.
Great tutorial. Thank you... How do you handle categorical variables for clustering? In this example looks like you removed the 1st column that happened to be a factor variable. Can you please post the data file used in the comments as well if possible? Thank you
Cluster analysis only works with quantitative variables. During the analysis you may note that we calculate distances, which we cannot do with categorical variables. But after finalizing number of clusters, you can plot dendrogram with a categorical variable to see if there is any obvious pattern or not. For data, send email id.
Between SS captures variability between clusters. When it increases, it indicates better clustering because within cluster variability will come down. Elements within a cluster should be closer to each other whereas elements between clusters should be further away for a good cluster formation.
There are 52 datasets where clustering can be applied in the link below: archive.ics.uci.edu/ml/datasets.html?format=&task=clu&att=&area=&numAtt=&numIns=&type=&sort=nameUp&view=table
Please can you give me a hint? I want to give as input the initial centres for kmeans clustering. I just do not manage to select these points out of my dataset. Thank you in advance for your help!
@@bkrai Because I try to correlate my clusters to the physical problem. That is why I was wondering if I can give initial centres as in case of software Origin Pro. I appreciate your answer.
your video is very helpful for me to learn cluster analysis, i also want to know does k- means can be applied to time series data as well, like 50 companies electricity consumption data of 3 months and each company has 24 hours of discrete values of voltage and resistance with time stamps .... can we use k means with time series?
A good tutorial , Could you please also tell us when should we go for Kmeans and When should we go for Hclust(I.E situations to select methods) 2. What do we mean when we say above average and below average (in Hclust) , i mean if the value is 1.05 so are we saying that sales in cluster x is higher 1.05 than average ?? a explanation will be appreacited.. REst everything is explained in a really simple way so Subscribing the channed :) Keep it up..
Hello sir, as always your videos have been very helpful and thank you for this video too. Also, I wanted to know if there is a way to improve between cluster distance? If so can you please let us know? Thank You!
Hi sorry I don't understand this. Why this dendogram have 22 variables ? Not results in 8 variables likes results in book of applied multivariate analysis? Can u explain please
@@bkrai oh ya. In applied multivariate text book, the same dataset, the dendogram cluster doesn't have the company, only have 8 variables in dendogram using complete linkage cluster . How can your result dendogram have 22 companies. Not 8 variables
Nice video as always. I have couple of questions. In K means cluster example, if we want a list as per the three clusters, how do we tag that. 2nd query, I have a data set of 100000 insurance customers having customer ids and their policy Face amount. I want to divide them in cluster ( say 5 cluster) and also want to know which customer comes in which cluster (same query as first) so that I can target them for a campaign. How do we do that and which clustering technique to use? Thanks in advance.
+Bharatendra Rai You are correct...sorry for the incorrect semantics. At 2:15, you mention that broadly, there are 3 clusters but they are based only on 2 variables. Is there a way to create clusters based on more than 2 variables?
Great tutorial, it really help for my analysis. Im having some douts, in that while silhouette calculation, whether we need to check average silhouette value, or which value we have to check to find out the number of clusters. Please help me with that. In your analysis what is the silhoutte value for k=3, where it is showing on that plot? Second while calculating my Euclidean distance, i have 40 observations, so it is not showing complete rows of Euclidean matrix, so is there any other way to obtain the complete matrix
Bharatendra Rai Thank you for your replying. Yes I wonder. The program is omitted rows by itself. I was doing until I get the dendrogram. The trend is good. But I have no idea it correct is.
Sir, Do you have more videos on clustering? Also, can I contact you in the future regarding clustering because I'm doing a research using data mining clustering?
Sir, You are very fast in replying , i am in Germany and here the time is 12 o clock in night and i am studying right now through your video and you have replied instantly , probably time in india is 3 o clock in night .. Thanks a lot for great content
Dear Bharatendra Rai can you please make some video based on SOM clustreing in with Examples and please brief about SOM clustreing in Hindi as well as English,, Please
sir can u make a video about D2.dist function of biotools packages to calculate d2 distance matrix easily and tochers method of clustering which is mostly used in agricultural research


Great tutorial!!...the way you explain is easy to understand...you should do more like this
Thanks for the feedback!
Please, how can I get the data utilities.csv? Thanks.
My goodness, this video is so complete, and clearly explained with details of the script... Thank you so very much... 100 points to you...!! You have a new fan...
Thanks :)
This is an excellent tutorial -- well presented and thorough. I followed along with my own application example (country healthcare per capita expenditure versus infant mortality rates of various types) and got very interesting results.
Thanks for comments and feedback!
5-star explanation. thank you! Very much recommended for beginners and intermediate R users. You got a new follower!
Awesome, thank you!
Great tutorial. I really like how you stuck to explaining the steps through a practical application. Thank you for this.
Thanks for comments!
Thank you so much Dr.B.Rai, I inspired your way of teaching even you in online, hopefully, every one enjoying your teaching
You are welcome!
Really thank you so much!!! The best tutorial on this topic!!!
You're very welcome!
If i had a thousand likes you would have received them all sir. Love the way you have explained and covered the concepts
Thanks, I’ll consider it 1000😊
Excellent explanation and code. I took the Johns Hopkins data science course, and clustering was part of the course. This video really helps explain the concept.
+Stephen Hobbs thanks 👍
Great tutorial! You are really helping a lot of people like me, and the best part is- drama, background music etc are completely missing unlike many other tutorials. Also saw some bhojpuri songs :)...thank you sir!
Thanks for comments and feedback!
This is truly an excellent, clear and concise tutorial. You covered a lot of topics in a short amount of time. I will be watching your other videos. Well done!
Thanks for your comments and feedback!
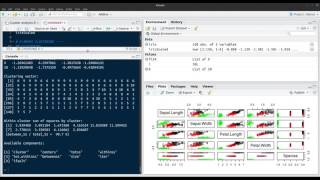
Hi Bharatendra, great video - really helpful!
Everything goes well until the point of doing the scree plot, I am getting:
> withinGroupSumOfSquares = (nrow(normNum)-1) * sum(apply(normNum, 2, var, na.rm=TRUE))
> for(i in 2:20) withinGroupSumOfSquares[i] = sum(kmeans(normNum, centers=i)$withinss)
Error in do_one(nmeth) : NA/NaN/Inf in foreign function call (arg 1)
> plot(1:20, withinGroupSumOfSquares, type="b", xlab = "Number of Clusters", ylab = "Within group SS")
Error in xy.coords(x, y, xlabel, ylabel, log) :
'x' and 'y' lengths differ
Can you help me? Thank you.
someone has deleted my comment...
+Jonathan Rhein Not sure what's causing the error you got. May have something to do with data. I ran my data using the code you have, and everything seems fine.
+Jonathan Rhein I still see your previous comment.
Thank you so much. This was easy to follow and I did my own analysis as we went along with almost no trouble. This was a breakthrough video for me.
You are welcome! For more detailed presentation, you may refer to:
ua-cam.com/video/otjWCaMcVaA/v-deo.html
Fantastic explanation! I followed along with a different dataset and it worked perfectly! Great work!!
Thanks for comments!
Hi Bharatendra, this is an excellent tutorial - the first one that worked for me. Great effort, keep up the good work!
+Emil Tsenov Good to know, thanks for feedback!
Thanks for such wonderful explanation.
By the way, I was working on a similar dataset, and apply didnt work for me. Although I removed all character vectors, but still the numeric vectors were returning 'NA'. I applied sapply and it solved the purpose.
Thanks again!!
Good to hear!
This is a brilliant tutorial which is easy to understand and follow.
Thanks for comments!
After a long time, I have seen such a good tutorial. Thanks, for your effort
+Arnab Jana Thanks for the feedback!
Great Explanation!
Thank you Sir For this Video Lecture
I will be watching your other videos.
Thanks and welcome!
Wah!!! how could u explain it so well!! Great job.
Thanks!
Very Informative, great slides and explanations. The delivery and presentation was good. I will be viewing other videos produced by Edureka. Some suggestions, show more examples. Present the limitations and god fit scenarios for K-means clustering.
Thanks for comments and feedback!
Good Job in explaining the content along with code..
can u provide us the link to download the dataset in this video to run the code.
Thanks for comments!
For data, there should be a link below this:
ua-cam.com/video/otjWCaMcVaA/v-deo.html
dear professor, I am so lucky to know you. could you also update full tutorial about using rmd and advanced model like hmm? Thank you and wish you have a great day
Thanks for the suggestion, I've added this to my list.
Thank you for this tutorial! it's amazingly easy to follow and thanks a lot for the script/file
+Roses Tube 👍
One suggestion to improve the video - When you click buttons and such please can you do it slowly so people can see where you click. Also perhaps consider using a highlight icon for your mouse? I had to watch 4 times before I realised you had pressed the 'run' button in the middle.
Thanks for the suggestion!
Hi Mr. Rai, great tutorial. Thanks for your effort. Just wanted to understand more about these 2 methodologies. Why and when we apply different methodologies i.e. K means and Hierarchy. It will be great help if you can make separate videos for the same. Also, as lots of people requested for data set and you have already uploaded to Dropbox, could you please share the link in your description for everyone's benefits. Thanks again :)
Initially we try all methods and finally choose the one that seems more meaningful for the dataset used. It's difficult to say which method will work best beforehand. Also thanks for your feedback and suggestions.
Thanks Bharatendra. Can you please upload video of how to performe clustering when the dataset has numbers of numerical attributes and categorical attributes. In this video you are eliminating categorical attribute. What would you have done if your dataset has 10 numeric columns and 8 categorical data.
Appreciate your knowledge contribution.
+Tushar Lapani For cluster analysis you must have quantitative variables. You can use categorical variables after cluster analysis to see if they show any pattern with identified clusters and use it for characterizing the clusters.
Lovely explanation:) easy to absorb.
Thanks for comments!
Very good tutorial ! impressively well explained. Thank you
You are welcome!
hello sir, great tutorial, you're a life saver for marketing analytics course!
I have a question regarding Scree plot code:
wss
it tries 1 to 20 clusters.
@@bkrai oh right, thanks alot! Can you also tell how do we deal with gender variable for clustering? What im doing is mutating a new var thats 1 and 0 instead of male and female. I then convert that to numeric variable. And then i do the usual process. Is this correct?
For clustering, we should use only numeric variables.
@@bkrai so how should i deal with gender? Its an important variable in marketing for ad targeting etc
you can put that on Dendrogram after clustering to see if it shows any pattern.
THE BEST !!! Could you please advise, do we need to do anything else to normalize if we are dealing with Binary columns (0,1). Thanks !
We should exclude such variables.
Thank you Sir for the tutorial.Please explain if there is any package is R to identify on what basis clusters are grouped from the data we provide.
Refer to the averages for each cluster and all variables.
Thank you for wonderful explanation. Appreciate your help with these amazing videos
Thanks for your feedback!
Nice and informative tutorial sir.
I am performing hierarchical clustering on my dataset with 10 variables and 200 observations. But the output is not very interpretable.
Please suggest how can I make it more interpretable.
Thanks.
You can explore other clustering methods and if they provide better insights. Here is the link:
ua-cam.com/play/PL34t5iLfZddvMPAl1TzHJ_GjQcD3s6w_Z.html
@@bkrai Thanks, sir.
I have one more query. I want to do cluster analysis on PCA.
Can you please suggest a good reference tutorial for doing that?
This approach will work fine.
thats really excellent explanation!
Glad it was helpful!
Thank you so much for the tutorial. It is extremely helpful. But my question like the other is that it would have been very kind of you if you would have linked your data set too. Thanks!
You can get it from here: ua-cam.com/video/otjWCaMcVaA/v-deo.html
@@bkrai Thank you very much! Appreciate it! :)
You are welcome!
Thank you so much for your amazing videos, everything is so clear and practical :) From a french research in cognitive science, I have one tricky question for you : i would like to find the best classifier/cluster analysis for repeated measures dataset (i.e., multiple repeated measures for one subject on the same features, as this is the case in experimental psychology research for example, or in longitudinal studies). Best
You can look into this link:
ua-cam.com/play/PL34t5iLfZddvMPAl1TzHJ_GjQcD3s6w_Z.html
Thanks for the informative video. May I please know how to deal with dichotomous variables along with continuous variables in the data if we want to include both in one cluster analysis, how do we do it please?
This link has more cluster analysis topics:
ua-cam.com/video/otjWCaMcVaA/v-deo.html
You are a great teacher sir, you are really awesome
Thanks for comments!
This is really Amazing...Thank you so much 😎
You are welcome!
sir please make the video on this K-mode also, that would be great to understand both topics and comparison
Thanks, I've added it to my list.
Dear Sir..thank you for the time & effort that you have put in to make this wonderful video tutorial.
I have a query. At 12:27 , how are the original average values displayed even though member.c is used which is obtained through a series of calculations using the normalised data?
Why did not you use PCA to decide the no. of clusters for kmeans?
Regards
Aniruddh
In the 2nd aggregation line, note that I've used utilities. That's the reason we can display original values. In the 1st aggregation, z was used. Also, here focus was on clustering, so pca is not used.
Thank you
nice tutorial Sir. Keep making such videos
Thanks for comments!
yes all your videos are helpful. Could you prepare a tutorial on machine learning in the tidy verse.
I've added it to list of future videos. Thanks!
This was really helpful THANK YOU! Make more! I would love it if you showed us how to do Latent Class Analysis in R, its not obvious right now
Thanks for comments and suggestion!
Great Video! Look forward to more videos!
Thanks for comments! For more machine learning videos you can use this link: goo.gl/WHHqWP
Fantastic presentation. Very helpful
Thanks for comments!
could you please explain why subtracting the first variable by [,-c(1,1)] rather than[,-1]? Thank you
Both work fine. You can use it if you need to remove more than one variable.
Thank you so much! Very well explained.
I would like to ask you if I still can use the Euclidian distance to find the closest elements of a cluster center, even if I use a dimensionality reduction approach (such as PCA, T-sne) that uses probabilities to arrange clusters in 2 dimension before using K-means.
Excellent tutorial! very easy to grasp.
+Nafin Ks thanks for the feedback!
nice explaination sir!!!!! thank you so much ....great respect ....sir if you would pls attach concern datasets with a video ...thank you once again
send your email id
rithishvikram4937@gmail.com
all set.
thank you so much sir
Wow. This was extremely helpful. Thank you.
You're very welcome!
Hello Sir, do you have any video on latent class clustering in R? Please share...Looking forward.
Not yet, but I'm adding this to my list for future. For clustering related videos, you may refer to this link:
ua-cam.com/play/PL34t5iLfZddvMPAl1TzHJ_GjQcD3s6w_Z.html
Thank you very much sir. Question: using Within group SS plot (min 14:39), isn't the optimal number of clusters 5? the variability from 4 to 5 seems very significant. Please let me know.
This data has only 22 companies. As we increase number of clusters, number of companies in some clusters becomes really small, to the extent that a cluster may contain just one company. So the choice of 'k' should also consider this aspect.
Great tutorial. Thank you... How do you handle categorical variables for clustering? In this example looks like you removed the 1st column that happened to be a factor variable. Can you please post the data file used in the comments as well if possible? Thank you
Cluster analysis only works with quantitative variables. During the analysis you may note that we calculate distances, which we cannot do with categorical variables. But after finalizing number of clusters, you can plot dendrogram with a categorical variable to see if there is any obvious pattern or not.
For data, send email id.
you can use K-modes to do clustering with categorical data
Thank you dear Sanchez. What about mixed data (i.e. including both numerical and categorical variables)?
vivek4u.3048@gmail.com
Really great tutorial, thank you very much!
+Eduardo Franco Chalco 👍
Would you please send me the scrip and data? email: efranco1@uc.cl
Sir, how to interpret the between SS/total SS value? In your example, it's 36% . How should that be interpreted?
Between SS captures variability between clusters. When it increases, it indicates better clustering because within cluster variability will come down. Elements within a cluster should be closer to each other whereas elements between clusters should be further away for a good cluster formation.
@@bkrai thanks Sir.
Can you please explain in K means clustering(Scree plot).What is the idea behind wss calculation
wss is within sum of squares that captures within cluster variability. When wss is low, then cluster formation is good.
Thank you @@bkrai
Thank you so much, very useful video.
Thanks for comments!
Sir, Can you please tell me whether it is necessary to do normalization to qualitative data?
No you don’t need it for qualitative variables.
@@bkrai Thank you sir
Excellent tutorial Bharatendra ! Do you have any example to share for Overlapping clustering - would appreciate it.
Thanks !
There are 52 datasets where clustering can be applied in the link below:
archive.ics.uci.edu/ml/datasets.html?format=&task=clu&att=&area=&numAtt=&numIns=&type=&sort=nameUp&view=table
Great tutorial. Thank you very much!
+Kandreitapomen 👍
Amazing...Really impressed
Thanks for comments!
this is a really great detail thank you! I appreciate the detailed guidance into understanding and checking cluster membership
It's good to hear your feedback! Thanks
Please can you give me a hint? I want to give as input the initial centres for kmeans clustering. I just do not manage to select these points out of my dataset. Thank you in advance for your help!
Why do you need that? The algorithm should automatically take care of finding the best clusters.
@@bkrai Because I try to correlate my clusters to the physical problem. That is why I was wondering if I can give initial centres as in case of software Origin Pro. I appreciate your answer.
Sir your video lectures are really awesome! Excellent Tutorial!
Can you please share the csv file used for cluster analysis?
send me your email id.
your video is very helpful for me to learn cluster analysis, i also want to know does k- means can be applied to time series data as well, like 50 companies electricity consumption data of 3 months and each company has 24 hours of discrete values of voltage and resistance with time stamps .... can we use k means with time series?
I would say try and see what you get, no harm in trying.
can you suggest a method for time series data.?
i tried it works fine but i want to use time and dates aswell any suggestions ?
This is a very informative video. I hope you would have a repository github of your data so that we can play around with the script you used.
Here is the link: github.com/bkrai/Top-10-Machine-Learning-Methods-With-R
A good tutorial ,
Could you please also tell us when should we go for Kmeans and When should we go for Hclust(I.E situations to select methods)
2. What do we mean when we say above average and below average (in Hclust) , i mean if the value is 1.05 so are we saying that sales in cluster x is higher 1.05 than average ??
a explanation will be appreacited..
REst everything is explained in a really simple way so Subscribing the channed :)
Keep it up..
For more on clustering:
ua-cam.com/video/otjWCaMcVaA/v-deo.html
Sir please do the vedio on PAM algorithms!
Thanks, I've added it to my list.
Do you have any examples of validating a cluster analysis using LPA?
I'm adding to the list of future videos.
great tutorial.please tell me how to label he clusters
You can come up with appropriate names for the labels by looking at averages for each cluster and each variable.
thank you sir, very well explained
Thanks for comments!
sir, it is quite good. I would really appreciate if you upload more videos .
+biswadeep das thanks for your feedback! I'll definitely create more such videos.
Hello sir, as always your videos have been very helpful and thank you for this video too. Also, I wanted to know if there is a way to improve between cluster distance? If so can you please let us know?
Thank You!
You can increase or decrease number of clusters and see which one improves between cluster distance.
Best tutorial ever thank you sir..got the concept bt sir can you please share the utilities dataset..🙌🙌
Thanks for comments! Send email id.
Bharatendra Rai imshubhamv.25@gmail.com
Thank you sir
all set.
Bharatendra Rai yes sir🙌🙌
Hi sorry I don't understand this. Why this dendogram have 22 variables ? Not results in 8 variables likes results in book of applied multivariate analysis? Can u explain please
On dendogram what you see are 22 companies for which clustering is carried out and they are not variables.
@@bkrai oh ya. In applied multivariate text book, the same dataset, the dendogram cluster doesn't have the company, only have 8 variables in dendogram using complete linkage cluster . How can your result dendogram have 22 companies. Not 8 variables
@@bkrai can I have your email?
I do not understand purpose in clustering variables. If the purpose is dimension reduction, PCA should have been done.
seemabharat@gmail.com
Thanks for the video... how can we get the video to practice on? Thanks again for the video
If you need data, send me email id.
@@bkrai my email ID # kamasbah@live.com
all set.
Nice video as always. I have couple of questions. In K means cluster example, if we want a list as per the three clusters, how do we tag that.
2nd query, I have a data set of 100000 insurance customers having customer ids and their policy Face amount. I want to divide them in cluster ( say 5 cluster) and also want to know which customer comes in which cluster (same query as first) so that I can target them for a campaign. How do we do that and which clustering technique to use? Thanks in advance.
You can use something similar to kc$cluster that I've used at around 16:30 time point in the video.
Thanks
Could you please send the data files for the practice what datafiles used in the tutorial.
email id?
Hello sir, please upload a video on Qualitative comparative analysis!! thanks again sir
I've added it to my list, thanks!
HAPPY NEW YEAR TO YOU AND YOUR FAMILY MEMBERS .
Sir ,If you have time please upload support vector machine and Sentimental analysis .
A very happy new year to you and family too! I'll keep your suggestion in mind for next videos.
Here is the link to SVM:
ua-cam.com/video/pS5gXENd3a4/v-deo.html&list=PL34t5iLfZddtII4ssT8FSUFP27fPYDEhY&index=25
Does mclust also required normalization of data?
It's always better to do normalization.
@@bkrai I have many files which I want to concatenate..should I concatenate and then normalize the data or should I normalize and then concatenate?
You can first concatenate.
@@bkrai Are you sure?
Thank you so much sir for informative video. You really made it easy.
Thanks for your comments!
Great video man! Thank you very much for posting :). Could you show cluster analysis using more than 2 variables?
+Azfer Saeed thanks for feedback! In the example we have cluster analysts with 8 variables. However for scatter plot we use two variables at a time.
+Bharatendra Rai You are correct...sorry for the incorrect semantics. At 2:15, you mention that broadly, there are 3 clusters but they are based only on 2 variables. Is there a way to create clusters based on more than 2 variables?
Great Video. Congrats
+Phedias Diamandis thanks for the feedback 👍
i want to remove multiple columns from my data set just like you removed the company. what code should I use?
let's say tou want to remove columns 2, and 4 from 'data' that has 5 columns. Then,
data1
Great tutorial, it really help for my analysis. Im having some douts, in that while silhouette calculation, whether we need to check average silhouette value, or which value we have to check to find out the number of clusters. Please help me with that. In your analysis what is the silhoutte value for k=3, where it is showing on that plot?
Second while calculating my Euclidean distance, i have 40 observations, so it is not showing complete rows of Euclidean matrix, so is there any other way to obtain the complete matrix
Thanks for great explanation sir. May I have data set for practice please.
Thanks again sir.
my mail ID is girish.nmore@gmail.com
all set.
It was so comprehensible for me, could you please send me the .CSV ? I need to make by myself the exercise.
My mail is ing.erikarias@gmail.com
all set.
Thank you so much, this tutorial have been so helpful for my class.
Thank you for your video.
I try to practice but my data are 48 rows, after I normalization, It omitted 26 rows
What should I do ?
Thank you
Normalization should not lead to omitting rows.
Bharatendra Rai Thank you for your replying. Yes I wonder. The program is omitted rows by itself.
I was doing until I get the dendrogram. The trend is good. But I have no idea it correct is.
@@klaows sometimes R does that just to reduce the output visually, you can adjust with options(max.rows = 9999999)
Sir, Do you have more videos on clustering? Also, can I contact you in the future regarding clustering because I'm doing a research using data mining clustering?
There is a playlist on clustering:
ua-cam.com/video/otjWCaMcVaA/v-deo.html
sir , can we not directly normalise the data using scales(utilities[,c(1,1)])
Yes, there are several ways to normalize and get same results.
Sir, You are very fast in replying , i am in Germany and here the time is 12 o clock in night and i am studying right now through your video and you have replied instantly , probably time in india is 3 o clock in night .. Thanks a lot for great content
I'm based in US, so problem with time.
I meant no problem with time
Dear Bharatendra Rai can you please make some video based on SOM clustreing in with Examples and please brief about SOM clustreing in Hindi as well as English,, Please
Thanks for the suggestion, I;ve added this to my list.
i am waiting for ur video based on Soms clustreing ...when it will uploads
Nice video and beautiful explanation... where can I download this data set utilities. pl help
send me your email id.
sir can u make a video about D2.dist function of biotools packages to calculate d2 distance matrix easily
and tochers method of clustering which is mostly used in agricultural research
Thanks, added to my list.
Sir how to remove multicollinearlity in cluster analysis as it is an unsupervised algorithm..there is no dependent variable..
Multicollinearlity is a problem only for regression models. For cluster analysis it not an issue.
How to plot clusters if I already know the affiliations of the nodes?
Not sure about your question, but you may try this:
ua-cam.com/video/wLu213JKfnQ/v-deo.html
Thank you, Very easy
You are welcome!
please add a vedio for how to do ward's method
seeing today, but thanks!