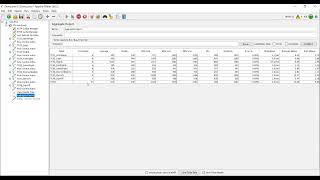
JMeter Integration with Grafana and Influx DB - Performance Testing
Вставка
- Опубліковано 24 гру 2021
- Performance Testing, Monitoring, JMeter, Grafana and Influx DB
Link to Download Influx DB
docs.influxdata.com/influxdb/...
Link to Download Grafana
grafana.com/grafana/download?...


Genuinely amazed at how simple that was, great video!
Thanks for the video, good content.
thank you, it was helpful!
Hi bro, so everything's fine for me on execution part except i don't see the different transactions in "transaction" item on the top, any suggestions ?
Regards
In the existing dashboard 5496, how can I create new graphs? Eg- I need to see the graphs which we have in the HTML report like No.of transactions Vs Elapsed time
Hi Udaya... I am trying to integrate jmeeter with influxdb 2.2 and Grafana . And I have installed influxdb2.2 and created listener in the jmeeter . While ran the test getting Authorization failed.
Can you please help me on this issue
While using the distributed test we will be able to view the results for both machines during the execution? Using backend listener
Hi Uday, I have downloaded the influxDB version 2.6 and 2.7 but I am not able to get influx.exe file there so that I can create database and other things. Please suggest what to do?
Hi Uday .. how we can add 90percentile in grafana dashboard
with influx 2.0, there is no concept of db. it is buckets and same grafana dashbaord cannot be used. I have tried it but not successful. Plz do try from your end
Sir How to show jmeter error codes in grafana dashboard??
Can not able see data after doing everything
Influxd.exe file is not opening. How to solve this issue
I am not getting individual response time. How do I configure? Thanks
First configure Jmeter and influx connection by adding back end listener and run some small smoke test and see logs if no erros , create grafana dashboard
@@udaykumar-mu5cu thanks Uday. I am able to see reports on the Grafana dashboard. However, unfortunately, i am unable to see 95pct for individual requests. It is showing mean of all requests in Grafana chart. Could you please share your query for 95pct chart from Grafana dashboard. Thank you
Thanks for the video. Unfortunately, you forget to provide the template link. Additionally, please try with influx2.0
Yes template link is grafana.com/grafana/dashboards/5496
Thanks sir for the explanation, but while running JMeter script with Influx DB I am getting error saying Unauthorized Access in JMeter. Can you please help to resolve it?
Hi Amit, please start JMeter after adding backend listener and after starting influx db server, after a small run, configure grafana then start your load test again
Hi Uday,
Urgent requirement - do you have any other tutorial for Gatling Grafana integration .
If it's paid also it's fine .pls help need this for some imp project. Please reply soon
hi bro, can you help me? my granfa metrics didn't display the number when select influxDB
template id 5496