Many thanks Chris. I couldn't work it out how the online teacher did it as there was no explanation whatsoever provided about the making of a chart/graph. your explanation - step - by -step, has clarified it with simplicity, to the point that i subscribed to your channel and thumbs up. keep up the good work. cheers.
I'm in the planning phase of starting my own business and working through "Hurdle: The Book on Business Planning." The author, Tim Berry, mentions this Break-even analysis. I have no business background but your video has explained this process so clearly, I completely understand it. While I am still working out all of the fixed costs for my product, thanks to you, these can be changed so easily. Thank you very much for this amazing tutorial. I am now a subscriber.
Thank u so much. I was getting too large of a number in the total expense part but after watching it for a while i realize i was using the total amount not the per unit one lol
This is very simple case. Do you have multiple product unit case. For instance i have different type of products and sales so i need to create Break even diagram. Do you have any video showing this?
Can I just ask why everyone is mentioning MBAs and this is in my 1st year undergrad? Seriously though, this was really helpful thank you! Legit question: how do you calculate sales volume for a specific profit margin without any formulas (using only the breakeven chart)?
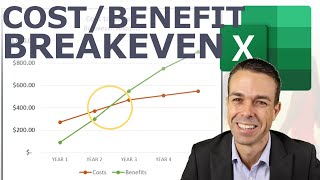
Hi! This was very helpful! One question- is there a way to place a vertical line within this chart to call out the break even unit needed? ( I know I could insert a shape to create a vertical line but I want this vertical line to be in the exact break even point)
I dont mean to be off topic but does anyone know of a trick to log back into an instagram account? I somehow forgot the login password. I love any tricks you can offer me
@Westley Ramon thanks for your reply. I got to the site on google and im waiting for the hacking stuff atm. I see it takes quite some time so I will reply here later with my results.
Your fixed expenses are normal, regular occurring expenses. So I would not include them. Now, if you are trying to figure out what the upfront cost to get your business running, then definitely include them.
@@ChrisMenardTraining I'm trying to figure out my break-even, considering all the money invested into the business altogether including my startup expenses which happen to be a large of it.
@Chris Menard I do have one question, if I may. I understand where the three per unit inputs come from (units sold, price/unit, and variable expense/unit) but do the total fixed expenses come from per month expenses, per week expenses, or am I just looking at that input incorrectly? You've put $1,600.00 combined from rent, taxes, insurance, executive salary. Obviously you're not using annual, or even monthly, projected numbers. Thank you.
The fixed expenses come from the time period you are trying to examine. If you want to do annually, make sure your Revenue and total variable cost is annual. If you want to do monthly, make sure your Rev and VC is monthly. Let me know if that answers your question.
Dear Chris, Your tutorial is easy to follow, thank you for sharing this video. However I would like to clarify if I am making a break-even point analysis for 3 years, would it be correct to choose average price, av.units, av.costs of 36 months? Please kindly let me know. Thank you!
I would think you would make a breakeven analysis for each year. I came up with this because when I’m doing projects for clients; I change the expenses and revenue per year. So, the calculations would be off if you just averaged them. But I guess it depends on what you’re using the data for in your particular use case.
This is great and so easy to understand, but like a commenter mentioned before, I'm doing a BE on services, AT&T to be exact and only have the data for a year for 3 years. How dow I convert units to dollar and when I do not have units or a number of services how do I make a chart with that?
Great video, thank you. I was wondering, what happens if the break-even point is a negative (as in the profit is negative)- does that mean my calculations are incorrect or does that mean the business is operating at a loss? Thank you!
I have to do 6.5 and round up to 7 for a calculation that I am doing. I also went to SBA website and their calculator did the same thing. Do you know why? I can provide my data offline. It is a private matter. Also, do you provide consulting and coaching for those not able to get MBA?
There are two things you have to know. You need to know the total fixed cost and need to know your Contribution Margin per unit, which is sale price - variable cost. Let's say Fixed cost is 6,000 and Cont Margin is 20 (30-10). Your breakeven is units is 300 (6,000 / 20). So to make the chart, I would start at 200 units and then 220 units and autofill down to 340 units. Now you can make your chart.
but i don't know the selling price per unit.the company which iam going to do project is not ready to give their cost sheets..they gave only annual report which contains only p/l a/c and balance sheet..i couldn't see the selling price and number of units sold..am i able to draw break even chart in any way??
hello sir, I'll just ask how will you know the amounts that you are going to input in the table in units to get the break even point because I have a data given by my professor and until now I'm still figuring it out, I hope that you can help me, thank you sir.
Dear Friends, I want to confirm: If a company has passed the break-even point, why should we do variable costs minimums and maximum fixed costs then the profits will increase more?. Thank you.
1. Suppose Keynes, Inc is considering buying a machine that will generate revenues of $6 million annually for two years and the $2 million in the third year. After three years the machine is worthless. If Keynes, Inc buys the machine, it must make a deposit of $ 2 million today and pay a further $11 million two years from now. Keynes, Inc has a minimum acceptable rate of return policy on investments set at 5%. a. Using an Excel function, find the breakeven interest rate. Can someone confirm if this answer is 100%?


This is the BEST video on creating a break-even analysis chart on the internet. Thank you!
Harry Gross thank you.
You are awesome. Straight to the point. No BS . Thanks for sharing this knowledge.
Many thanks Chris. I couldn't work it out how the online teacher did it as there was no explanation whatsoever provided about the making of a chart/graph. your explanation - step - by -step, has clarified it with simplicity, to the point that i subscribed to your channel and thumbs up. keep up the good work. cheers.
Thank you so much man, I cannot express how grateful I am, this helped me out SOOOO much... you just earned yourself a subscription. 😁
Thanks for the sub!
This was extremely helpful and was the only thing that got me through my Break Even Analysis project! Thank you so much, God bless you!!!!!!
Thank you. I appreciate the positive feedback.
I dont say this often but this youtube video is a life-saver!
Thank you! I appreciate the positive feedback.
I'm in the planning phase of starting my own business and working through "Hurdle: The Book on Business Planning."
The author, Tim Berry, mentions this Break-even analysis. I have no business background but your video has explained this process so clearly, I completely understand it.
While I am still working out all of the fixed costs for my product, thanks to you, these can be changed so easily.
Thank you very much for this amazing tutorial.
I am now a subscriber.
Fantastic! Thank you, Bob.
Thank you so much for sharing this! Have a great day, sir. 🧡
TY
Very helpful for my MHA, detailed and straight to the point.. Thanks!!
Glad to help.
Excellent details, quick and very understandable.
Thanks Alison
I'm just gonna thank you so much for this
Glad to help. I appreciate the positive comment.
Nice video. Thank you Sir. With great respect from Russia!
Thanks, Christ, you saved my life! My Bussiness plan presentation will be fine now.
thanks man, I'm in culinary right now and we had to do one of these for our marketing course and I sure didn't know how at all.
Glad I could help!
Thank you Christ, Informative and wonderful video...
This video was so so helpful. Thank you!
Thanks much for that. You deserve subscriptions.
thank you Chris. you saved my life with this video
Thanks, Chris!
Glad to help.
EXCELLENT! IT HELP ME SOLVE MY PROBLEM
Glad to help.
Informative video
Glad you think so!
Thank you for this, very helpful and to the point.
I appreciate the feedback. Thank you!
Wow thanks for that! Greetings from Switzerland :)
My pleasure!
Great video! Thank you for your help.
You're welcome!
thank you Sir it was very helpful
You are most welcome
This was really helpful for my MBA Assignment, Thank you so much!
Thank you, Emma! I appreciate the feedback. Good luck with your MBA program.
Thank you for the video
You're welcome
thanks for your help, well grateful
You're welcome!
Awesome, Thank you
You're welcome!
Brilliant! Thank you so much!
You're very welcome!
Lots of love!!! THANK YOU SO MUCH YOU JUST SAVED MY ASS :)
thanks partner, ur the best ❤
Thank you.
Thank u so much. I was getting too large of a number in the total expense part but after watching it for a while i realize i was using the total amount not the per unit one lol
Thank you so much this was so help to me it help with my forecast and budgeting assignment.
Glad to help and I'm glad you found it useful.
This is really helpful for me! Thank you. Can you show how to expand on this for multiple products/units?
Here is my blog post and a video for multiple products. chrismenardtraining.com/post/breakeven-excel-multiple-products
@@ChrisMenardTraining Thank you!! Thank you for replying!
Thanks for explaining it so well!
I appreciate the feedback. Thank you.
This was very helpful and well done! Thanks!
Thank you. I appreciate the feedback.
This is very simple case. Do you have multiple product unit case. For instance i have different type of products and sales so i need to create Break even diagram. Do you have any video showing this?
Here is how I handle multiple products. chrismenardtraining.com/post/breakeven-excel-multiple-products
Thank you @@ChrisMenardTraining .
You are welcome. Glad to help.
Thank you for help
Happy to help
thanks a lot, it was very helpful
I appreciate it. Thanks, Collin.
Thank you sir
Welcome
thank you sir!
You are welcome!
Dude thank you for making this tutorial, simple to follow.
Glad you liked it!
Can I just ask why everyone is mentioning MBAs and this is in my 1st year undergrad?
Seriously though, this was really helpful thank you!
Legit question: how do you calculate sales volume for a specific profit margin without any formulas (using only the breakeven chart)?
Thank you so much!!! This helped me so much!
Glad to help, Mandy
thank you, my accounting homework asks for this chart but doesn't teach you how to create one in the first place.
Glad it was helpful!
Thank you so much, this is really helping me now.
Thank you, Phatchara.
This is great. Thank you!
Devon, I'm glad you liked the video. I appreciate the feedback.
Thanks for share.
You are welcome.
Chris Menard based on your video , I will apply this by sales man in my company . Cheer from Brazil. Stay safe !
useful! thanks for sharing
THANK YOU!!!!
Glad to help
Thank you so much. God bless!
Is startup expenses included in fixed cost? or Fixed cost is a monthly expenses?
Thank you it was helpful
Hi! This was very helpful! One question- is there a way to place a vertical line within this chart to call out the break even unit needed? ( I know I could insert a shape to create a vertical line but I want this vertical line to be in the exact break even point)
I dont mean to be off topic but does anyone know of a trick to log back into an instagram account?
I somehow forgot the login password. I love any tricks you can offer me
@Gunnar Fabian Instablaster :)
@Westley Ramon thanks for your reply. I got to the site on google and im waiting for the hacking stuff atm.
I see it takes quite some time so I will reply here later with my results.
@Westley Ramon it did the trick and I now got access to my account again. I am so happy:D
Thanks so much you saved my ass!
@Gunnar Fabian no problem :D
Thanks for the tutorial chris. Quick question; can i add my startup expenses like computers, working equipments, furnishing etc. to my fixed cost?
Your fixed expenses are normal, regular occurring expenses. So I would not include them. Now, if you are trying to figure out what the upfront cost to get your business running, then definitely include them.
@@ChrisMenardTraining I'm trying to figure out my break-even, considering all the money invested into the business altogether including my startup expenses which happen to be a large of it.
Wanted to know break even analysis in excel for multi products
I did that video on this blog post I wrote. chrismenardtraining.com/post/breakeven-excel-multiple-products
@Chris Menard I do have one question, if I may.
I understand where the three per unit inputs come from (units sold, price/unit, and variable expense/unit) but do the total fixed expenses come from per month expenses, per week expenses, or am I just looking at that input incorrectly?
You've put $1,600.00 combined from rent, taxes, insurance, executive salary. Obviously you're not using annual, or even monthly, projected numbers.
Thank you.
The fixed expenses come from the time period you are trying to examine. If you want to do annually, make sure your Revenue and total variable cost is annual. If you want to do monthly, make sure your Rev and VC is monthly. Let me know if that answers your question.
@@ChrisMenardTraining That does answer my question.
Thank you very much. 😀
so the contribution margin that I have is lower than the fixed expenses is there an issue with that?!
Dear Chris,
Your tutorial is easy to follow, thank you for sharing this video.
However I would like to clarify if I am making a break-even point analysis for 3 years, would it be correct to choose average price, av.units, av.costs of 36 months? Please kindly let me know. Thank you!
I would think you would make a breakeven analysis for each year.
I came up with this because when I’m doing projects for clients; I change the expenses and revenue per year. So, the calculations would be off if you just averaged them.
But I guess it depends on what you’re using the data for in your particular use case.
This is perfect. Thank you =)
Lowla Starlexx thank you for the feedback
Chris Menard your welcome :)
This is great and so easy to understand, but like a commenter mentioned before, I'm doing a BE on services, AT&T to be exact and only have the data for a year for 3 years. How dow I convert units to dollar and when I do not have units or a number of services how do I make a chart with that?
Amanda, are you saying you know Revenue and Expenses but not how many units were sold?
please teach how to add alternative project profits in a single chart
thank you sir
Love it
Thank you. Break-even is one of my favorite videos.
Hi, how make this in power bi thank you.
Great video, thank you. I was wondering, what happens if the break-even point is a negative (as in the profit is negative)- does that mean my calculations are incorrect or does that mean the business is operating at a loss?
Thank you!
I have to do 6.5 and round up to 7 for a calculation that I am doing. I also went to SBA website and their calculator did the same thing. Do you know why? I can provide my data offline. It is a private matter.
Also, do you provide consulting and coaching for those not able to get MBA?
How would the margin of safety fits in here?
I made a video of Margin of Safety. ua-cam.com/video/p_jiPwgY96E/v-deo.html
Hi, is it possible to add 2 lines or arrows to point automatically on the chart the break even point?
I'm not sure if that is possible. Obviously you can manually draw an arrow. To have it automatically do that would require more chart data.
iam doing a project on cvp analysis.. how can i draw a bep chart without knowing the units sold
There are two things you have to know. You need to know the total fixed cost and need to know your Contribution Margin per unit, which is sale price - variable cost.
Let's say Fixed cost is 6,000 and Cont Margin is 20 (30-10). Your breakeven is units is 300 (6,000 / 20). So to make the chart, I would start at 200 units and then 220 units and autofill down to 340 units. Now you can make your chart.
but i don't know the selling price per unit.the company which iam going to do project is not ready to give their cost sheets..they gave only annual report which contains only p/l a/c and balance sheet..i couldn't see the selling price and number of units sold..am i able to draw break even chart in any way??
what is the exact reason for increasing P/V ratio
thank youu!
You're welcome!!
hello sir, I'll just ask how will you know the amounts that you are going to input in the table in units to get the break even point because I have a data given by my professor and until now I'm still figuring it out, I hope that you can help me, thank you sir.
and the breakeven point is 4,757 in units
You need to know something else. Do you know the contribution margin per unit or Fixed cost?
Can you make a break even chart for a variation of services?
Zakiya Agosto not sure what you want. Can you send me some data?
This video applies to products or services. It is break-even on multiple products. ua-cam.com/video/uIZzd_FzEjY/v-deo.html
i love u man
Thank you.
Dear Friends,
I want to confirm:
If a company has passed the break-even point, why should we do variable costs minimums and maximum fixed costs then the profits will increase more?. Thank you.
Happy yoga day
1. Suppose Keynes, Inc is considering buying a machine that will generate revenues of $6 million annually for two years and the $2 million in the third year. After three years the machine is worthless. If Keynes, Inc buys the machine, it must make a deposit of $ 2 million today and pay a further $11 million two years from now. Keynes, Inc has a minimum acceptable rate of return policy on investments set at 5%.
a. Using an Excel function, find the breakeven interest rate.
Can someone confirm if this answer is 100%?
Have my babys
thank you sir
Most welcome