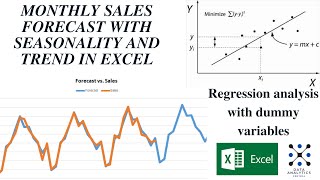
Seasonality and Trend Forecasting Video 2: Multiple SKUs

Вставка
- Опубліковано 2 лип 2020
- This is a follow-up video to
• Operations Management ...
In this video I explain how to find seasonality adjusted trend forecast for multiple products (SKUs) at the same time. I chose not to de-seasonalize data set before finding the trend parameters.
Dataset URL: Copy and Paste it into Excel or work in Google Sheets
docs.google.com/spreadsheets/...


Man, this is such a brilliant video! Thank you so much for this!
I enjoyed every bit of it and will help me so much at my current work!
Thanks a ton again, you are the best!
Doc, your videos are incredible. . I mean absolutely so well done. Explained clearly, easy to replicate and apply to my profession. Thank you 🙏🏻
These are extremely valuable videos and great content. Thank you!
I've been looking for you for all my life!!! Thank you very much!!!
Feel so happy! I actually learnt something great and practical. Thank you!!
Dear Mustafa Hocam
As a sales professional, what you have tought me will enlighten my forecast figures so as to determine the right target in the future.
Çok teşekkürler üstad!
Ben teşekkür ederim, faydalı olabildiysem ne mutlu!
It was extremely helpful! I appreciate your efforts, you really make a lot to educate people
Wish you the best in your career, you really inspired me to learn more about Excel
Thank you so much❤️
Thank you!
Amazing video. Thanks for creating it.
Brilliant. Thanks!!
Really thanks you so much man!
amazing.....I studied supply chain and all this manually 1998....we were not explained any of this in university.....thank you for share...wow
Glad it was helpful!
Excellent video
JZK
This is great.
Awsome, thanks so much!
great tutorial! what formula would you use for 2021 forecasting taking into account a significant drop in demand due to Covid? would you use a range for just 2020 in the TREND formula?
Unfortunately, as it is an unprecedented situation you would either use a subjective approach or use a % reduction in your forecasts, if you observe a certain amount of decrease in demand.
Hi,Pls. suggest when I have data set for the period of Apr-19 to Sept-21, I wanted to derive forecast for the period of Nov-21 to May-21 using this data set. I had tried to derive forecast looking at your video, but no value no value generated.
Hi, it's really very helpful. Can you drop a video over Generating Bottoms-up forecast and sku splits at an Item/Week/Location level??
Great stuff Mustafa! A lot of e-commerce companies I work with would benefit from implementing a forecast like this. Question for you. A chunk of clients fall in the category of only having 6-12 months of data. So they don't have a full 365-day cycle in their data. If I'm dealing with say, 6 months of data and could get a few parameters from the customer, do you have an approach you'd recommend on how to create a forecast? Customers are in all sorts of industries. A lot of clothing, sports equipment, gifts, personal care products (some subscription offerings). I know there are obvious limitations, but wondering if you could give me a point in the right direction. Thanks!
Thank you! It really depends on the dataset at the end. One approach could be to use a regression model if you have other variables along with the time periods. But the monthly seasonality may not be taken into consideration because you will have only one data point per month.
This is amazing ! my company actually applied this one for its Demand Planning Project. Here's a request could you please make a video on Predicting Optimal Pricing point using multiple regression model where our variables could be historical Sales data, Competitors' prices, Cost etc.(You can use other relevant variables to make it more realistic) .I work as Pricing Analyst at one of the leading retail chains and there are 100k+ SKUs so we need to decide on best possible prices. I tried to develop one such model but didn't succeed due to P-value/t-value tests . But the good thing is it helped me introduce this idea of Regression into my company that eventually led us to watch this video and utilized it for Demand Planning.
Thank you for letting me know! I am happy to hear that. I will look into the pricing video idea.
@@mcanbolatAny Luck?
This is great! Thank you for your video! What do you do with forecasted negative values? Obviously, I cannot have -4 units produced.
I love your videos too!
I have a question - at my work we measure unique clients for a project. We also could benefit from predicting total unique clients for the year. I am not positive if there is a consistent trend each month, but it seems as the contract year begins we have many more unique clients than per month at the end of the contract
I would hope we could calculate the trends in monthly declines (which I think is the slope or sindex, I cannot apply my knowledge yet)
But I want to predict/forecast the rest of the year based on actual progress (so I hope to update it monthly/quarterly with the actual unique clients and the formula can adjust for more accurate forecasts each month quarter)
Is this possible?
Thanks. First, you need to create a chart of your historical data to see if there is trend and/or seasonality. Then based on your historical data, you will need to choose an appropriate forecasting method.
Yes, once a new data is available, you can recreate your forecasting model and make a prediction for the next future period.
Thanks sir
Thank you for the share. How would you calculate the accuracy of this forecast? and is there a way to forecast if we have different origins to fulfil the demand?
I would use RMSE = Root mean squared error. It tells you the average variance between the actual and predicted values. There are other metrics as well to evaluate the performance, e.g. MSE, MAE or R squared.
Thanks for Video!!! Average of()/Average() Seasonal Index in formula if some SKU i dont have last year same month data then forecast will get 0, how we can calculate
Hi Mustafa, how to forecast per years? I have 2 years data only.
This is extremely helpful and insightful. I have one question regarding seasonality where the value is 0 for several months where product is not available due to growing seasons. The zero is impacting the trend and average...
Thanks, you may have to exclude those months if you are not planning to find a forecast for them. For example 8 months or 8 seasonality indices per year.
Can you do a video or suggest the best method in excel to predict multiple products following intermittent demand pattern. Thanks your lectures are inspiring.
Found a formula =forecast I believe this solves quite the case.
Thank you for the video!
Is it possible to implement this forecast for a brand new company ?
Let say a company with 100+ SKUs has been established for 1 year (12 months) and it wants to make a forecast for its SKUs. Can we use the same method as shown above for this case ?
Yes it may work but it may not be very accurate. It will only use one data point to determine the seasonality. If there is no seasonality in your data, you can use other methods like moving averages, etc.
Can u recommend operation management books? My main concern is forecasting and raw material management. TIA.
Production and Operations Analysis by Nahmias is more Industrial Engineering focused and detailed.
Thank you so much for this video and explanation! Is there an easy way to transpose the data in this model and not break the formulas? I have over 100 SKUS I'm using this model to generate sales forecast for and side scrolling is not the smoothest experience.
You may try the function TRANSPOSE(). It is an array function. All your horizontal cells can be displayed in a vertical format.
@@mcanbolat Thank you! This worked great!
hi, thanks for the video. I have a question. why did you not use the trend function in the exercise with a single sku even though this component was there too? sorry for the dummy question.
Just to teach different ways of doing it :)
Hi! Can you explain how your Average of()/Average() Seasonal Index helped or was more accurate that Forecast ()?
The forecast function only looks at a linear trend. This is adjusted for seasonality, the Forecasting tool in Excel would also work.
Hi Mustafa, good day, this is a really helpful video! Just want to ask if how can I break that monthly forecast to weekly and daily without having the same average day of week allocation?
Hi you can make your seasons as days or weeks instead of months if there is a pattern of daily/weekly seasonality in your dataset.
@@mcanbolat why did I never think of that! thank you so much! Happy to have found your page!
Hi I was just wondering how to do forecast for 3 months so January, February and March for 2023 based on 1 year data from 2022? Also would be useful to know how to predict for promotional sales. We have a promo running during those periods. Thanks!
Did you find out how?
hi, thank you so much this is very beneficial! what if i want to forecast quarters? and the product is new, so for example i need to forecast September 2020 but my product was released January of 2020, so an error will appear because in the criteria it can't find sep of 2019, what changes do i apply.
Also, how can i find the error of this? and is it okay that i have some negative values?
thank u mustafa
Hi Shaden,
For the quarters just change the months to quarters: Q1, Q2, Q3, Q4.
If the product is new, you won’t be able to use the seasonal indices as you do not have historical data to create them. For new products, a qualitative method such as expert opinion may have to be used.
The error calculation was shown in my other forecasting videos.
Mustafa Canbolat
Thank you!
i tried looking for the error calculation video but could not find it, can you refer me the link please?
Also, one last question, is it okay that i'm getting negative values? They make sense without the sign but i don't know.
Hello. Is this similar to Triple exponential smoothing without the alpha smoothing parameter ? What’s the difference and why is the computation of triple exponential smoothing so complex?
Hi, no this is a different methodology and it uses the linear trend model along with seasonality indices. We cannot say one method is better than the other one, because each may work better for different datasets. You can search for Holt-Winters forecasting which is triple exponential smoothing. I am planning to create a video but I do not have one yet. Also, Excel's Forecast Sheet (Under the Data tab) uses the triple exponential smoothing method.
@@mcanbolat is there a way to incorporate the exponential smoothing into the equation?
@@mcanbolat shouldn’t all data that has a trend and seasonality be forecasted with winter-holts method? I guess it really depends MSE for all forecasts
Thank you so much for your great video, Sir ! How to fix formular if some months in period have no quantity (=0) or null?
Is available to get different format (color, style) for forecast line in chart which is similar to use forecast sheet? Appreciate your advice !
Hi, you can replace them with 1. The forecast may not be accurate when you have a large number of missing values.
You can manually adjust the color, or you will need to write a VBA code.
@@mcanbolat Appreciate your answer. By your exert knowledge, how do you think this compare to regression forecast thru excel toolpak since I found very different result. Thank you !
Great video! Will this still be accurate if one only has a single year of historical data?
If your seasonality occurs monthly, there would be only one data value per season. So it may not work.
Hi Thanks for the great video, really helps. I wanted to predict collection based on past trend of Sales and collection for multiple customers, could u suggest a way to do it.
Sounds like a regression model if you have other variables along with the time series. I have a video on that.
Hi - how do forcast day wise sales from previous years day wise sales data ??
You need to see if data has seasonality in days, weeks, or months. It is the same idea, you just have more seasons (repeat patterns)
Hello Professor! If I have the four and half year data, how I can use those data? Can I only use the data from June 2019 to June 2023? OR Can I use the data from Jan 2019 to June 2023?
Hi, yes, you can use it from Jan 2019.
Hi!
sir this has been solved my life, but I dont know how to get all the negatives that I've been obtaining for the forecast, what should I do on those cases?
Hi That would be something you need to decide, you can consider them as zero. If your numbers are fluctuating a lot with values close to zero, it is inevitable.
Hi Sir, what does it mean if get negative trend value?
I had the same question.
Hello Sir
Can you please guide me on how I can build a interactive dashboard for demand forecasting in excel.
Can you suggest any other sources on youtube where I can learn making demand forecasting dashboards?
Thank You
Hi Vyankatesh, for dashboards, it is better to move to Power BI instead. Unfortunately it is not my expertise.
Hi Mustafa sir, what if do not have some data points available to project at all? how to we handle the absense of enough data points
Hi
If you have a season (i.e. month) where there is no sales at all during that month over time, you can exclude that month. If you have some missing data points, you can use the median sales in that month and replace the missing data with the median values. You can search for data imputation to find out more about replacing missing values.
@@mcanbolat thanks sir, will try to do it this way!
Sir how do you break your monthly forecast down to weekly, daily and per daily interval forecast?
Hi If there is a daily or weekly pattern, you can find the seasonal indices for days or weeks.
@@mcanbolat Hi Mustafa, I'm a bit of an excel dummy, so I was wondering how one can make seasonal indices for past daily data
@@sujayshetty3158 You can just change the months to days, from 1 to 365. But you should have at least four or five years of data to capture the seasonality.
how is this different than using the forecast function
hello i've used your formula for my college, but what is the precise name of this method. i need to explain about the methodology and conceptual framework in my report.
I am not aware of any specific name for it but you can call it as “ the seasonality and trend model with seasonal indices”.
@@mcanbolat thank you, also i got 5-6 values in negative is that suppose to happen if im forcasting sales?
Hello, thank you for this awesome video. Quick quesiton, doest this method also understands the growth that one company has? For example Jan 21: 250 sales; Jan 22: 500 sales; Jan 23: 750(??) Thank you so much!
Yes, the trend part of it forecasts the growth (or decline).
Thank you for the quick reply. One more question, how do you overcome the challange of months when an item was out of stock and sales stopped as the item is not continuing selling when OOS? This will disrupt trends and sales numbers. Is there a method/formula we can use to overcome this and understand how that period would look like in terms of sales if we never ran out of stock?@@mcanbolat Thank you
There is no perfect solution but you may replace the actual value with the forecast value for that month if the stockout was unexpected and use that value instead. This video provides a quick solution; you should understand how forecasting models work to go around possible issues. I recommend reviewing an operations management textbook chapter.
Dear Professor , kindly suggest a very good book for hospital and laboratory supply chain management
Any Operations Management book like Heizer and Render’s one would be a good start. Also Kros and Brown Health Care Operations and Supply Chain Management may be good.
Wonderful
Hi, for this formula (AVERAGEIF($C$2:$C$49,$C51,D$2:D$49)/AVERAGE(D$2:D$49)*TREND(D$2:D$49,$A$2:$A$49,$A51)), may I know how is it derived?
There is another video where I show how to derive the formula. Forecasting with Seasonality and Trend.
Dear Professor Mustafa Conbolat : extraordinary presentation . Can I implement this for my laboratory inventory ? I am a lab director
Hi sure, but if there is no monthly seasonality, this may not be a good fit.
Dear professor , could you please elaborate the dollar sign interpretation and usage ? I found difficult to interpret
What is the name of this method dude? I wanna find this method theory on Google scholar for my thesis
Hi Sir, could you please teach us how to make a forecasting for deviation ( between a seasonality forecast and actual). For example: As now is 2022, the 2020-2021 have changed to actual data, then we create a forecasting for deviation to make inventory to minimise the uncertainty data. Thank you very much..
All forecasting methods aim to minimize the deviation. You just need to enter the new data into your actual set and update your forecast for the future period. But with the new data, you may have another forecasting method more accurate. It is a good idea to observe your dataset, try multiple forecasting methods and pick one that gives you the smallest error measure.
@@mcanbolat Thank you Sir. ...:-)
How is it different from the forecast function in excel?
The Forecast function assumes a linear trend with no seasonality. The Forecast sheet tool under the data tab will take seasonality in account.
Hi Sir, I need an urgent help with forecasting the data with 2 variables. Could you please help me?
I am not able to provide individual help but my forecasting with regression videos will help. Please check the channel content.
Thank you for the help. I just wanted to check one thing. if we want to forecast for 2021, we need to change the formula slightly and include demand till D61 right?
Yes that is correct.
I always thought winter-holts for forecasting required exponentially smoothing for items with a tren and seasonality?
Not always. It is one of the many methods available. It may work better or not depending upon the dataset.
@@mcanbolat how do you for which data? Large aggregate demand for winter-holts?
Just add Round to make demand and forecast similar. No decimals @D51
=ROUND(AVERAGEIF($C$2:$C$49,$C51,D$2:D$49)/AVERAGE(D$2:D$49)*TREND(D$2:D$49,$A$2:$A$49,$A51),0)
Hi, First thanks for the video. I can only foracast for twee weeks. After that i get a error. The error i get is #DIV/0!. Can you explain what the problem is ? and how to solve it.
It usually is due to not using a necessary $ sign when copying pasting.
@@mcanbolat Is it possible that it only works with months and not with week?. Because the formule only works on the month of May. I have added the $ the same way as you.
Yes, you need to change your formula if you are using weeks. If you understand the logic behind the formula it would be easy. I have another video with months but it provides more details. You can have 52 weeks as your seasons, or days of the week as your seasons.
@@mcanbolat Can you send my the link?