
- 46
- 52 356
Matthew Peterson
Приєднався 1 чер 2012
Hi! I am an aspiring community ecologist researching soil microbial communities in many different environments. I often have had to troubleshoot rstudio issues by myself (yes I am self-taught). While I am no expert, I feel that I am proficient enough to help the average user troubleshoot common issues I have encountered and have gone down an endless rabbit hole of frustration to figure out. We will see how this channel grows!
Animated Plot (make a .gif in R!)
#ggplot2 #gif #rstudio #tutorial #coding
Using gganimate you can create a gif to show data over time!
In this video I break down code from the blog post "Top 50 ggplot visualizations" r-statistics.co/Top50-Ggplot2-Visualizations-MasterList-R-Code.html
Using gganimate you can create a gif to show data over time!
In this video I break down code from the blog post "Top 50 ggplot visualizations" r-statistics.co/Top50-Ggplot2-Visualizations-MasterList-R-Code.html
Переглядів: 170
Відео
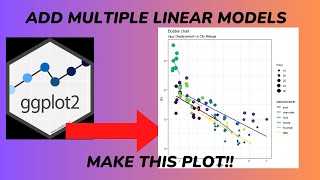

Ggplot2 Bubble Chart with regression!
Переглядів 764 місяці тому
#rstudio #ggplot2 #tutorials #coding Show multiple regressions dependent on your data in the same single plot. In this video I break down code from the blog post "Top 50 ggplot visualizations" r-statistics.co/Top50-Ggplot2-Visualizations-MasterList-R-Code.html

Ggplot count plot
Переглядів 614 місяці тому
#ggplot2 #rstudio #tutorial #coding Increase point size for items with more overlapped data! In this video I break down code from the blog post "Top 50 ggplot visualizations" r-statistics.co/Top50-Ggplot2-Visualizations-MasterList-R-Code.html

Ggplot jitter function
Переглядів 815 місяців тому
#ggplot2 #rstudio #tutorial #coding Eliminate overlapping data with the jitter function! In this video I break down code from the blog post "Top 50 ggplot visualizations" r-statistics.co/Top50-Ggplot2-Visualizations-MasterList-R-Code.html

Ggplot scatter plot with encircled data
Переглядів 965 місяців тому
#ggplot2 #rstudio #tutorial #coding Encircle subsets of your data you want to highlight in ggplot! In this video I break down code from the blog post "Top 50 ggplot visualizations" r-statistics.co/Top50-Ggplot2-Visualizations-MasterList-R-Code.html

Ggplot correlation scatter plot
Переглядів 1905 місяців тому
#ggplot2 #rstudio #coding #tutorial In this video I break down code from the blog post "Top 50 ggplot visualizations" r-statistics.co/Top50-Ggplot2-Visualizations-MasterList-R-Code.html

Streamline your calculations in R
Переглядів 1457 місяців тому
#rstudio #tutorial #coding Calculating the same data in excel hundreds of times over is tedious and there are better ways to utilize your time! Automate those calculations in R using dplyr to streamline your quadratic equations. Here is my code blog, if you want today's code added, leave a like! rpubs.com/ecomattp/1137343

Put a spin on your bar charts!
Переглядів 428 місяців тому
#rstudio #coding #tutorial polar charts put a literal twist on your data!

Flip your boxplot (ggplot tutorial in rstudio)
Переглядів 768 місяців тому
#rstudio #coding #tutorial overlapping text in your boxplot? use coord_flip!!!!
Stacked Bar Charts and using Jitter in Scatterplots within ggplot2
Переглядів 1139 місяців тому
Stacked Bar Charts and using Jitter in Scatterplots within ggplot2
Introducing Geoms (ggplot2 tutorial)
Переглядів 1029 місяців тому
Introducing Geoms (ggplot2 tutorial)
Quit wasting your time! Improve your ggplots fast!
Переглядів 490Рік тому
Quit wasting your time! Improve your ggplots fast!
Make a grouped boxplot with pairwise comparisons (ggplot2)!
Переглядів 1,2 тис.Рік тому
Make a grouped boxplot with pairwise comparisons (ggplot2)!
These simple shortcuts are highly underrated!
Переглядів 44Рік тому
These simple shortcuts are highly underrated!
How to get started in Rstudio (importing files)
Переглядів 49Рік тому
How to get started in Rstudio (importing files)
RStudio ggplot2 tutorial (multi-line timeline)
Переглядів 9252 роки тому
RStudio ggplot2 tutorial (multi-line timeline)
Rstudio ggplot tutorial (create a timeline using ggplot)
Переглядів 1,4 тис.2 роки тому
Rstudio ggplot tutorial (create a timeline using ggplot)
RStudio ggplot2 tutorial (exporting png files)
Переглядів 6542 роки тому
RStudio ggplot2 tutorial (exporting png files)
I think Quarto is more like LaTeX but with interactivity and ability to do calculations.
I think another package needed to be loaded for the stat_compare_means to run, as I tried to run it with just ggplot2 and it would not run
I'll need to look at what I load more closely this weekend, but you may need ggpubr loaded. Sorry for the lack of clarity in the video!
@@ecomattp for the stat_compare_means you need the ggpubr package ^^
Nice video. But how to get the significant letter grouping and show them on the boxplot?
Hello! To get you an answer sooner than later check this video out: ua-cam.com/video/Uyof3S1gx3M/v-deo.html they do a good job explaining this exact item of interest. I hope this helps!
@@ecomattp Thank you. This is very helpful.
Thanks for the great explanation, Matthew!
Thanks! Appreciate the praise, I have a tutorial on gganimate coming up that I'd be interested to hear your thoughts on/any feedback is welcome 😊 cheers!
Please can yu share the script
I will work to get this on my blog this weekend!
🤝🤝🤝🤝🤝🤝
After creating my comparision list, are the comparisions among with fertilizer treatment of different accessions? Or without fertilizer treatment?
That's a good question, in this regard it would be comparing accessions (ignoring treatment). If you wanted to isolate treatments in their own figures you could create the same comparison list and it would compare accessions within the NF treatment or the WF treatment (or whatever you happen to name your treatments). If you want to try and keep everything in one panel of figures I would suggest looking at faceting your figure.
'PromoSM' 💥
Can you share your code for this video?
Hi! After giving it some thought on the best way to share my code I made a quarto blog and the code for this video is the first to be put on it! you should be able to find it here: rpubs.com/ecomattp/1137343
Would you like to share the script?
Hi! After giving it some thought on the best way to share my code I made a quarto blog and the code for this video is the first to be put on it! you should be able to find it here: rpubs.com/ecomattp/1137343
Thank you! Keep uploading more videos of unusual plots
perfekt overview
great video! could this be done with the bootstrap method? Also instead of numbers, how can you add asterisks?
Hello! To answer your second question, yes you can. In the line stat_compare_means you would need to add annotations=*** to your specific list of what you want to compare. This link should provide further detail! stackoverflow.com/questions/49008460/add-p-value-or-asterisk-to-ggplot As far as using a bootstrap method, I have not done that myself, but that's not to say it is not possible. Here is a pdf of a document I found that may be useful: pages.stat.wisc.edu/~larget/stat302/chap3.pdf I hope this helps!
ahh man you explained this so nicely!
is p value 0.93 comparing Afghan and Viridis or is it showing the statistical difference across the accession
It would be comparing only Afghan and Viridis, if you wanted to compare across all accessions I would look at using an ANOVA but also consider distinguishing between treatments.
Matt, for your particular case there is a wonderful package called fpp3 by Robert Hyndman and associates. It is wonderful and it works - even with the tidyverse. PS. - your code cannot be read - the resolution is too low and it is all fuzzy (even at the highest res).
There is a neat package in R called vistime. It used to have an extension called - gg_timevis() to work with ggplot2 and generate static time lines that look pretty neat. However, when I tried it I got an error message stating that gg_timevis no longer exits. Anyone seen this?
Is it there a way of making all comparisons instead of just Control vs the rest?
Sorry for the late response! Good question. If you wanted to compare everything I would recommend an ANOVA (analysis of variance) which will compare everything. However, I just did control to each different treatment in this video to demonstrate customizable comparisons. Therefore, if you wanted to make other types of comparisons like I did in this video, the process is the same as shown, you would just need to create the list of comparisons you want to display.
Hi. Me too, i can't see well the screen
Hey, sorry about that! Not sure why the video is blurry. I re-recorded the video here: ua-cam.com/video/kfvvRUXAqrI/v-deo.html this should be much better!
Hi, Matthew, I got a strange problem. There is no "Render on Save" button in my quarto. Do you have any idea about this issue? Thanks a lot.
I apologize for such a delay in response. I hope you have solved your issue! But if not here is a link to a possible solution: community.rstudio.com/t/quarto-render-button/143423
Thanks, Matthew.@@ecomattp
I can't see well the screen
Hey, sorry about that! Not sure why the video is blurry. I re-recorded the video here: ua-cam.com/video/kfvvRUXAqrI/v-deo.html this should be much better!
😆😆😆
great explaination! do u know how to make multiple year in this chart type? as in this case, it is only using 2019 data, what if I want to make it into 2019-2020 data with monthly plot?
Sorry for only getting to this comment now! Check out my other video, hopefully it helps ua-cam.com/video/IKoh4oiKtsg/v-deo.html
Hi, i keep getting an "R code execution error" every time i type in the stat_compare_means command. I have installed the package
This could be anything from network connection to needing another package installed. Without seeing the code I cannot fully assess what the issue might be. If you copy and paste the error into google that may help.
Thanks for very useful video!
Hi Matthew, Thanks for the video. Would it be possible to create the venn diagram taking into account the abundance of each bacterial taxa? Is it possible to avoid the binary transformation of the data? And how would I go on about it? Thanks, Stefano
Hey Stefano, Great question! You can create the diagram without doing the binary transformation, you can simply skip that line of the code and the rest should still run smoothly!
@@ecomattp Hey Michael, I tried skipping the binary transformation line but now instead of having 3 circles (3 treatments) it only creates one. Since I want to compare the total abundance of taxa between treatments, I am also skipping two other steps that you included: 'remove taxa that sum up to 0' and 'remove taxa that sum up to less than 4 for each rep'. Could that be an issue?
I appreciate your teaching method and it is very interesting.
Thank you! I appreciate hearing that!
Thanks for the excellent video. How do you activate that green line that appears when you run the code eg at 5:05?
If you highlight the section of code you want to run and press control + enter it should appear to show the progress of running your code. If there are errors it would become red. Good question!
Hi, thanks for the video. which function can I use if I only want to show one of the lines, rather than all of them? Thanks
You can use the same exact syntax, just only tell it to select the single set of data you want to show in the line plot. For instance in this video I tell it to select both 2018 AND 2019 in the geom_line section. If I remove the geom_line for 2019 it would show the timeline with just 2018 data. You will also need to remove the geom_point line that calls on the 2019 data or else the data will show up still without a line. I hope this helps!
Great workshop and effort.
So it is filter(iris, Sepal.Length == 4)
The error appears because of using = instead of == to denote equality. = is an assignment operator equivalent to <-
The video quality is very poor. I can barely see anything
Hi, thanks for pointing this out, not sure why the beginning is like this, but around 1:15 it improves on my end! Hopefully that is the case for you as well.
Hi thanks for the video, greatly helped. I was just wondering if it would be possible to add the Tukey's test as well in the code using the stat_compare_means?
Hello! You should be able to add it into stat_compare_means. It might be that you add it in as a t.test rather than an ANOVA. It would look something like this: stat_compare_means(method="t.test"). I hope this helps. If not here is a link to break down the components of adding comparisons in ggplot: rpkgs.datanovia.com/ggpubr/reference/stat_compare_means.html
Very nice video, how can I do for two factors anova?
@@rajendraregmi2892 Great question. You would need to run ggplot through a series of pipes "%>%" leading with your data frame, in this case DN_Master_Data %>% (insert the ggplot script to create your boxplot). Then after you create your plot you can do a summary function of "anova" as such anova(lm(pH ~ Treatment, DN_Master_Data)). This creates a linear model and you can further detail interactions within this function. To avoid being too long winded, here's a link to a detailed explanation of how you can achieve this! I hope this helps: publish.illinois.edu/liangf/teaching/stat-424/rcode-two-way-anova/
@@ecomattp Thank you. I will go through this link and let you know if I need more help. Thanks
Hey, I try to use your code but I don't understand some of them , could you explain the number in this line, what did they do ? january<-january[which(rowSums(january[,-1]>0) >=((ncol(january)-1)/2)),]
The [,-1] represents the removal of data with the parameters we will set in the remainder of this line. In this case we are saying "if the data across all of our samples sums up to 0, remove it" hence why 0 is listed after [,-1]>0. I hope this helps
You helped me with the argument "main". Now i can go on to add "B" (figure label) customized!
Right away I got "Warning message: package ‘ggplot2’ was built under R version 4.1.2 " :(
Is this data set available so that we can follow along?
@@nf3922 Warnings are different from error messages in RStudio, so ggplot2 should still work! The dataset is not available unfortunately, but it should work similarly with pre-loaded datasets such as iris in RStudio. Keeping that in mind I will aim to use pre-loaded data in future videos! I hope this helps.
Good Morning! can you make the script available? where it is? Very nice video.
Here is the script including the packages I typically use for all of my figures: install.packages("dplyr") # one of the core packages of the tidyverse, extremely helpful for dataframe manipulation install.packages("tidyr") # used to help reshape data into tidy data that is easier to manipulate install.packages("permute") # allows you to perform permutations install.packages("lattice") # aids in graphics to provide better defaults to easily display multivariate relationships install.packages("vegan") # this is your go-to community ecology package. Used for ordination, diversity analysis and more. install.packages("goeveg") # aids your vegan package in ordination diagrams, species response curves, and rank-abundance curves install.packages("ggplot2") # your optimal package for creating excellent graphs and figures install.packages("tidyverse") # a collecton of R packages designated for data science (the parent package to ggplot2, dplyr, tidyr and more) install.packages("nlme") # for Gaussian linear and nonlinear mixed-effects models install.packages("ordinal") # facilitates analysis of ordinal data install.packages("ggsignif", type="win.binary") # significance brackets for ggplot2 install.packages("ggpubr", type="win.binary") #This is the package for running anova with the stat_compare_means line install.packages("multcompView") install.packages("ggthemes") #now that we have installed our packages we need to access them by loading them in our library. library(ggpubr) library(ggplot2) library(dplyr) library(tidyr) library(permute) library(lattice) library(vegan) library(goeveg) library(tidyverse) library(nlme) library(ordinal) library(multcompView) library(ggthemes) #making a timeline with multiple lines and a legend precip <- read.csv("INSERT YOUR DIRECT PATH TO CSV FILE HERE MAKE SURE YOU USE FORWARD SLASHES") #organize your data by month because the default is alphabetical precip$Month <- factor(precip$Month, levels = c("Jan.", "Feb.", "Mar.", "Apr.", "May", "June", "July", "Aug.", "Sept.", "Oct.", "Nov.", "Dec.")) ggplot(data = precip, aes(x=Month, group=1))+ geom_line(aes(y=Twenty18, color ="2018"), size=1)+ geom_line(aes(y=Twenty19, color ="2019"), size=1)+ scale_color_manual(values = c("2018"="darkred","2019"="steelblue"))+ geom_point(aes(y=Twenty18), size=2)+ geom_point(aes(y=Twenty19), size=2)+ theme_classic()+ theme(axis.title.x = element_blank())+ labs(color = "Year")+ ylab("Precipitation (mm)") I hope this helps!
I and unable to put compare lines on box plot and showing the error ....error in stat_compare_means(comparisons = my_comparisons, method = "wilcox.test") : could not find function "stat_compare_means". Please let me know how to solve it
These are all of the standard packages I use: (ggpubr is crucial for this method) library(ggpubr) library(ggplot2) library(dplyr) library(tidyr) library(permute) library(lattice) library(vegan) library(goeveg) library(tidyverse) library(nlme) library(ordinal) library(multcompView) library(ggthemes) check to see if you have these installed! If that doesn't work, here's a website that breaks down the same process: www.sthda.com/english/articles/24-ggpubr-publication-ready-plots/76-add-p-values-and-significance-levels-to-ggplots/
Still month did not work for me. I got NA. Is there any package shall I download before starting? thanks so much
These are all of the standard packages I use for any project I start, not all will directly relate to the timeline you are trying to make, but in general I have found helpful. library(ggpubr) library(ggplot2) library(dplyr) library(tidyr) library(permute) library(lattice) library(vegan) library(goeveg) library(tidyverse) library(nlme) library(ordinal) library(multcompView) library(ggthemes) I hope this helps! If you continue to have issues, let me know!
@@ecomattp Thanks a million Matthew. You are such a great person. the date in x axes works now, but still a problem existed. when I use geom_line, the points are not linked together. every two neighbor points are linked vertically. If you know how could I overcome this problem, I would really appreciate your help. I really got headache
@@OMAR-ce1bj I'm glad you have one issue fixed! As for your current issue...if you are trying to plot 2 separate lines in the same plot it likely will return an error. If you want, copy and paste your script that you are using and I may be able to better answer your problem!
@@OMAR-ce1bj I just created a new video that I think will provide the answer you are looking for! ua-cam.com/video/IKoh4oiKtsg/v-deo.html
Great video as always! Thanks Matthew!
Upvoted! Thank you for the video :)
Looking forward for more great videos! Thanks so much.
My friend Loves Rstudio and data cant wait to see what your channel puts out in the future :) !!!!!1!
Hi Matthew, Thank you very much for the informative video! When looking at your dataset, is it possible to plot graphs for height, wt_weight, moisture, etc all at once? Without having to change the code little by little for all the result.
Thank you for the feedback! The short answer to your question is yes! It would take some adjustments in the file that you input, or the use of dplyr to arrange your data correctly and then facet_wrap within ggplot2. I will try to make a video soon to address this :)
@@ecomattp Thank you so much for the reply! Looking forward to all your upcoming videos :D
Great video! Would love to see the same but with a grouped boxplot to show how to add pvalues of within and between group comparisons :)
Thanks for the feedback! I will see about making that video soon :)
This is pretty cool dude
can you pls explain to me what each thing mean in the plot? Is the line showing the mean or the median ? for example
Sorry for not seeing this until now! A box and whisker plot (which is what is shown in the video) shows the full range of the data. The box itself represents the interquartile range of the data. What I mean by this is that the lower end of the box is the 25th percentile, the middle line is the 50th percentile (better known as the mean), and the upper end of the box is the 75th percentile. Additionally, the whiskers (the lines extending above and below the box) represent the sample error of the data and can expose outliers in your data as well. This is why some of the whiskers are longer than others. This is because it depends on the treatment.
i tried using the Start_comapre function, but it doesn't work (I installed and library the ggpubr package), can you pls help?
Hello! You want to make sure you use stat_compare not start_compare. Minor difference in syntax, but will be the difference for the script working versus not in this instance. Hope this helps!
@@ecomattp thank you!!