
- 12
- 80 652
LITE ACADEMY
Приєднався 8 тра 2021
Dear Students and Researchers!
Lite Coach aims to provide Curated and simplified contents that equips engineers with relevant skills required for a successful career in Engineering.
🎯 Complex Engineering topics Simplified
🎓 Learn something new daily.
🔥 Engineering Simulations Using ANSYS
📈 Ansys | Matlab | Python | OrignPro
Thanks for visiting my channel.
Connect with us using:-
Email : mail.litecoach@gmail.com
Instagram: @thelite.coach
LinkedIn : @thelitecoach
How to install PYTHON 3 / JUPYTER Notebook using ANACONDA Navigator in Windows 10.
Installation of Python in Windows.
Переглядів: 214
Відео


How to plot Zoomed Graph in OriginPro? Place one Graph in another Origin Graph.
Переглядів 24 тис.3 роки тому
How to make zoomed/ enlarged / magnified plots in Origin ? This video answers that. How to plot using Origin Software? This video is about Graphing in OriginPro software. Origin is a popular graphing tool used by Scientists & Engineers. #LearnOriginPro #Origin # Zoomed_Graph ➖➖➖➖➖➖➖➖ Mentioned in this video: 🔔 Subscribe - Lite Coach Email : mail.litecoach@gmail.com 🗣️ Follow me on Instagram and...

How to plot PIE Charts in OriginPro?
Переглядів 2,1 тис.3 роки тому
This video is about PIE Chart Plotting using in OriginPro software. Origin is a popular graphing tool used by Scientists & Engineers. #LearnOriginPro #exponential_regression #regression #exponentialfit #theLiteCoach #polynomialfit ➖➖➖➖➖➖➖➖➖➖➖➖➖➖➖➖➖ Watch Video on Polynoomial Fitting for density www.youtube.com/watch?v=LxDMP... The density, a thermophysical property of water is being used to exp...

Multiple Line Graphs? Insert Symbols? How to Plot in Origin?
Переглядів 41 тис.3 роки тому
This video is about Multiple Line Plotting using in OriginPro software. Origin is a popular graphing tool used by Scientists & Engineers. #LearnOriginPro #exponential_regression #regression #exponentialfit #theLiteCoach #polynomialfit How to insert Symbol Map into origin graph explained! ➖➖➖➖➖➖➖➖➖➖➖➖➖➖➖➖➖ Watch Video on Polynoomial Fitting for density ua-cam.com/video/LxDMPhzZJzU/v-deo.html The...

Understand Linear Regression Easily. Using Origin Pro to do Linear Regression, Machine Learning.
Переглядів 2393 роки тому
How to calculate the Beta of HDFC bank Stock in CAPM? Linear Regression in OriginPro and MS Excel This video is about Linear Regression using in OriginPro software. Origin is a popular graphing tool used by Scientists & Engineers. #LearnOriginPro #exponential_regression #regression #exponentialfit #theLiteCoach #polynomialfit #linear #linearregression #CAPM #Betaofstock #hdfcbank #scatterplot #...

Polynomial Fitting In OriginPro to find Density of Water as a Function of Temperature.
Переглядів 2603 роки тому
This video is about polynomial fitting using in OriginPro software. Origin is a popular graphing tool used by Scientists & Engineers. #LearnOriginPro #exponential_regression #regression #exponentialfit #theLiteCoach #polynomialfit ➖➖➖➖➖➖➖➖➖➖➖➖➖➖➖➖➖ The density, a thermophysical property of water is being used to explain the concept of polynomial fitting in OriginPro. The fitting equation for De...

Exponential Fitting In OriginPro to find Viscosity of Water as a Function of Temperature.
Переглядів 7893 роки тому
This video is about exponential fitting using in OriginPro software. Origin is a popular graphing tool used by Scientists & Engineers. #LearnOriginPro #exponential_regression #regression #exponentialfit #theLiteCoach ➖➖➖➖➖➖➖➖➖➖➖➖➖➖➖➖➖ Link to Previous Video In this series Polynomial Fitting ua-cam.com/video/LxDMPhzZJzU/v-deo.html The viscosity, a thermophysical property of water is being used t...
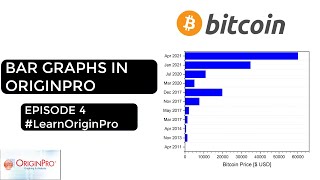
How to plot Bar graph/ Column Graph in OriginPro #theLiteCoach #bitcoin #cryptocurrency
Переглядів 1163 роки тому
his is a tutorial about graphing in Origin. Origin is a popular graphing tool used by Scientists & Engineers. #LearnOriginPro #bitcoin #ethereum #cryptocurrency #theLiteCoach ➖➖➖➖➖➖➖➖➖➖➖➖➖➖➖➖➖ This video demonstrates how to plot a BAR graph using OriginPro. Follow along with the videos and you'll make BAR/ Column plots. ➖➖➖➖➖➖➖➖➖➖➖➖➖➖➖➖➖ Cryptocurrency is most popular in recent days. Cryptocurr...

How to make Simple Line Plots Using Origin. Learn Origin Basics.
Переглядів 5083 роки тому
#theLiteCoach #originpro #LearnOriginPro #Excel #MatLab #Python This is a tutorial about graphing in Origin. Origin is a popular graphing tool used by Scientists & Engineers. #LearnOriginPro #theLiteCoach ➖➖➖➖➖➖➖➖➖➖➖➖➖➖➖➖➖ This video demonstrates how to plot a simple line graph using OriginPro. ➖➖➖➖➖➖➖➖➖➖➖➖➖➖➖➖➖ 🔔 Subscribe - theLiteCoach 🗣️ Follow me on Instagram 🙂 - thelite.coac...
How to make DOUBLE Y PLOTS Using Origin. Graphing in OriginPro
Переглядів 5003 роки тому
This is a tutorial about graphing in Origin. Origin is a popular graphing tool used by Scientists & Engineers. #LearnOriginPro #bitcoin #ethereum #cryptocurrency #theLiteCoach ➖➖➖➖➖➖➖➖➖➖➖➖➖➖➖➖➖ This video demonstrates how to plot a double Y graph using OriginPro. Follow along with the videos and you'll make double Y plot of Bitcoin and Ethereum. ➖➖➖➖➖➖➖➖➖➖➖➖➖➖➖➖➖ Cryptocurrency is most popular ...
Plotting Multivariate Equations In MATLAB. 3D Surface Plot Using MATLAB
Переглядів 10 тис.3 роки тому
This video demonstrates how to plot a multivariate equation in MATLAB. Follow along with the videos and you'll make 3D contours and surface plots easily! The functions used are fsurf(), meshgrid(), surf(), surfc(), contourf(), contour(), colorbar Contents 1. 3D plot of equation using fsurf() function. 2. 3D plot using the meshgrid() function getting contours 3. Saving a 3D plots Download the MA...
Which software you are using sir?
You are not aware of how much you helped me. I can only say Thank you.
Thanks to you, very instructive video.
Please, according to your video, assuming there were 7 columns for the Shear stress values, will the graph show the 7 lines? I have been trying to plot a graph with 7 lines, only 4 of them are showing on the graph. I'll appreciate your response. Thank you.
Thank you, Cntr+D, was new for me
thanks dear sir ji
You are the king!
Thank you for your sharing!
good
How to check a function is increasing or decreasing by using mesh plot
good
This shows how to plot and animate, the butterfly equation using MATLAB 2022. THIS is plotted using the parametric equations.
Thank you very much Sir
Thanks 😊 . Happy to know its helpful.
thanks, really helpful
Thanks for this video. Please I need help plotting a graph, showing various treatments, 2 soil depths and 2 soil types
I think what you need is double y plot, do check my videos. 👍
Is there a way i can send the sample of what i need
@@samsonvictor6155 sure, you can mail me, but i am bit busy these days. I will try to reach you fast.
Ok thank you
@Lite Academy., just sent you the sample
thank you a lot
I was busy with some works, If any of you need any help, please feel free to comment. I will try to make more videos
if two lines are very close to each other then how can they be sperately visualized
Yes, what we can do is, get a zoomed plot. I have done a video about it. Do watch. If you have any more querries, you can comment it. I will try my best to help you
Thanks Buddy
Thanks for this video
Thanks sir,this is a life saver
Hi. excuse me I need link program origin 32bits
You can download the studnets version of the Origin software, from their website
Great and well-explained video. Thanks
Perfect! Thank you
Small chart does not update itself dynamically after I place it inside the main chart. Any solution for this?
Yes there is that issue! I think what you can do is to update the small graph fully and then paste it into the main graph. Also I will check if there is any way to automatically update both simultaneously, but even I have to look into it. If I get any new techniques I will upload a new video. Thank You
That's great work sir 👌
thanks bro , i am searching how to add more column for plotting multiple line in one graph , this video help me a lot
If you need any help, feel free to ask in the comment section. I'll try my best to help you guys.
Hi, thank you for this interesting video, i would like to ask you, how to plot a multiple stress-strain curve with offset x axis? mean, we have a few stress-strain curves in x axis with different starting point, not all starting at the origin 0. thanks.
I think we can specify a particular or common starting point, say 0.03(x axis). If you need more help, please feel free to mail me. mail.litecoach@gmail.com
@@liteacademy thank you. I think the explanation is enough for me to give an idea how to plot it.
Good
2:51 ۞―i̳P̳h̳o̳n̳e̳ 1̳2̳ P̳r̳o̳ G̳i̳v̳e̳a̳w̳a̳y̳―۞ ➡️➡️️ 》》 ua-cam.com/video/49mwt6s95aY/v-deo.html 《《 -----------------^^----------------- ♠【﹄💖𝐊𝐋𝐈𝐊≔⫸LINK 💖﹃】 ♠みゃあこさん!ฅ( ̳• •̫ • ̳ฅ)ニャン !❤️ 在整個人類歷史上,強者,富人和具有狡猾特質的人捕食部落,氏族,城鎮,城市和鄉村中的弱者,無`'守和貧窮成員。然而,人類的生存意願迫使那些被拒絕,被剝奪或摧毀的基本需求的人們找到了一種生活方式,並繼續將其DNA融入不斷發展的人類社會。 說到食物,不要以為那些被拒絕的人只吃垃圾。相反,他們學會了在被忽視的肉類和蔬菜中尋找營養。他們學會了清潔,切塊,調味和慢燉慢燉的野菜和肉類,在食品市場上被忽略的部分家用蔬菜和肉類,並且學會了使用芳香的木煙(如山核桃,山核桃和豆科灌木 來調味食物煮的時候 1620553828