
- 17
- 49 993
Chloe Fouilloux
Приєднався 24 бер 2020
Having Fun with Random Effects in Mixed Models (GLMMs)
Hiya!
We're back with coding. This is probably the most statistically challenging concept we've attacked yet, so tie up your shoelaces and let's venture out into the magical world of coding!
*Jump around the video if you can't be bothered to listen to my exquisite story-telling*
00:00 Introduction
00:13 Defining Random Effects
00:35 Random Effect Examples (and what makes a good one!)
01:28 Introduction to the Palmer Penguin Data
02:06 Introduction to glmmTMB
02:37 Setting up the model
03:06 *Model 1*, "Islands" random intercept
04:13 Variance vs. Standard Deviation
04:43 Random Effect Variance vs. Residual Effect Variance
05:34 Looking at level-specific random intercept estimates
06:22 WTF is your (Intercept)???
07:22 *Model 2*, "Species" random intercept
07:53 (Explained again, but better?) Random Effect Variance vs. Residual Effect Variance
09:05 *Model 3*, Nested Random Effects
10:56 *Model 4*, Multiple Predictors biologically "reasonable" model
11:24 Understanding (Intercept) for multiple predictors
**Links!**
Palmer Penguins
allisonhorst.github.io/palmerpenguins/
Recommended Readings
peerj.com/articles/9522/
(Source of figure from thumbnail: DOI: 10.7717/peerj.9522/fig-1)
bookdown.org/steve_midway/DAR/random-effects.html#introduction-3
peerj.com/articles/4794/#
Code for this video:
github.com/chloefouilloux/Random_Effects/tree/main
Переглядів: 1 906
Відео
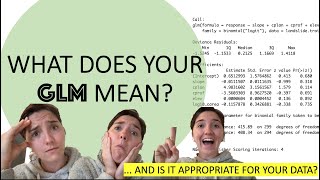

How to interpret (and assess!) a GLM in R
Переглядів 27 тис.Рік тому
Hi! New to stats? Did you just run a GLM and now you have an output that you have no idea how to interpret? Then this video is just for you! In addition to interpreting the output of standard GLM models in R, we also go over diagnosing the suitability/appropriateness of a GLM for your data. Our mantra: Just because it runs, doesn't mean it's right! Jump around the video: 0:00 Introduction 01:06...

Create a Google API key for R from Scratch
Переглядів 1,6 тис.Рік тому
This is a quick and easy tutorial of how to create and use a Google API key without any previous knowledge. Ends with a quick example of how to use an API key in R for the first time with an applied a Google Map example. *Jump around the video* 00:00 Introduction Google API keys (from Google maps to R studio) 00:28 Starting on Google Cloud 00:41 Registering on Google Cloud, Payment 01:23 Create...

AI Cheats for Easy Time Series Plots
Переглядів 860Рік тому
In this video I challenge an A.I. chatbot (ChatGPT) to a code-off! Just how much can this thing do, and how can you use it to solve your coding problems? *Boxing Rounds* 00:00 Introduction to ChatGPT 00:31 ROUND 1 Basic Scatter plot 02:13 ROUND 2 Changing points into images. . . OF HORSES 05:08 ROUND 3 Time Series plot 06:39 ROUND 3.1 Time Series and Logical Statements 08:14 T.K.O Time Series a...
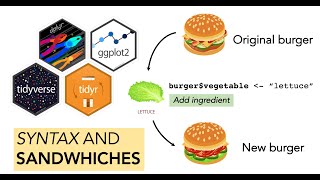
A deep-dive into data-wrangling in R (tidyverse)
Переглядів 1,1 тис.Рік тому
In this video we will be taking a deep-dive into the #tidyverse and looking at how to use data-wrangling and cleaning (using #tidyr and #dplyr) to conquer difficult data and transform the most challenging sets into beautiful #ggplot2 visualizations. *Jump Between Concepts* 00:00 Welcome to the Tidyverse 00:40 Beavers Data 02:42 Introduction to the "$" 04:43 Introduction to the %pipe% 05:20 Intr...
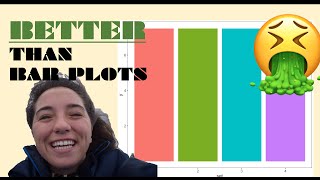
Better than bar plots: Custom point ranges in ggplot2
Переглядів 1,8 тис.2 роки тому
Friends don't let other friends make bar plots. Here we are going to transform an awful bar plot into a customized sexy point range using ggplot2 in R! Want the code? Download all the code from this video from my GitHub: github.com/chloefouilloux/chloefouilloux/blob/master/betterthanbarplots Let me know what you think and what you would like to learn next! Stay plotty.

Aggression in cannibals
Переглядів 2553 роки тому
Hello! Today I am here to tell you the riveting story of aggression in juveniles. . . with the classic M. Knight Shyamalan Twist. . . juveniles are also aggressive cannibals! Using baby frogs as a model, we inquire into how kiddos gauge their aggression towards others. Is aggression rooted in relatedness (i.e. don't attack your sister) or in size differences (i.e. don't attack a huge random guy...

Oikos Workshop: Data visualization in R using ggplot2
Переглядів 4,4 тис.3 роки тому
Hello! Welcome to the gRaphics workshop; this presentation was originally hosted in the context of the Oikos 2021 Conference over Zoom (hence my cropped face during the live-code session. . . oops). Here you can follow along the first part of a two-part workshop (Part II by Sara Hocevar, who covers creating icons and graphical abstracts, Part 1: ua-cam.com/video/SjccbeMBhMQ/v-deo.html, Part2: u...

D. tinctorius aggression display (Siblings)
Переглядів 1343 роки тому
Here is a snippet of a behavioral assay between two Dendrobates tinctorius tadpoles. Check out our pre-print about aggression in larval cannibals! biorxiv.org/content/10.1101/2020.10.26.350132v1.full.pdf
Stylish Scatter Plot using ggplot2 in R
Переглядів 10 тис.4 роки тому
Stylish Scatter Plot using ggplot2 in R
I would have loved to have found that vid like a week ago.
Thank you so much for this! I have been trying for hours to figure this out!
Gemini (Google's ChatGPT) brought me here!
Bonsoir Cholea, merci pour tel introduction , neamoins , je voudrais bien savoir si la meme API key peut etre utilisee pour d'autres buts par example pour collecter des reviews /Bewertungen sur un produit ou bien un service ?
I just arrived here, and I have to say thank you soooo much for this video! You are very didactic Hugs from Brazil 🥰
Absolutely amazing! thanks so much! Another request, what to do with data that has **a lot** of zeros? Please keep posting videos like this; you are indeed amazing at explaining what is going on and what we should be looking for! Thanks!
Hello! Thank you for the video! May I ask to explain in details what Estimates mean in GLM please? Or where can I read more about it?
Thanks Chloe, how can I make the plot as the one you have at 3:06 minutes for the different species?
Great explanation, you have a talent for explaining complex things well !
super helpfuil! Would love a video showing how to compare models (and esp mixed effect models) for best fit!
What if I want to test interections (they were significant for Tukey test)? What commends should I write?
Hi, thanks for the explanation of the GLMM analysis. I have a question: Do you applied DHARMA::simulateResiduals after created the last model? Thanks :D
You are incredible! I enjoy every second I watch your video
Statisticians like to generalize and GLM is a generalization of lots of survival cases. For example, OLS regression is a surgical case of a GLM with a Gaussian link. Fit an lm() and a Gaussian GLM, and you'll get identical results.
Hi, why is R studio producing different results even though I am using the same call and data.
Hmmmmm, I wouldn't know without looking at your code, but you can check out the code of this video that I have annotated on my GitHub to see if there are any mismatches. github.com/chloefouilloux/GLMOutput/blob/main/GLM_Output.Rmd
You manage to make statistics fun anc cool! wow. Thank you so much. You are great
That's a great video about the interpretation of the GLMs, but I'm confused because according to some references GLMs do not assume that you have the same variance within groups or while your continuous variables grown right? This is because it uses the log likelihood to estimate the parameters of the model to model the mean value. online.stat.psu.edu/stat504/lesson/6/6.1 also in the book Categorical Data Analysis, Agresti
thank you for the information.
Thanks for the feedback 😸 I'm working on a follow-up video that might include interactions and other model families. If it's okay could you let me know what info you felt was lacking? I'm always trying to improve on explanations!
🤐🤐🤐🤐🤐🤐🤐
@@chloefouilloux ohh thank you so much for the prompt reply. I am just frustrated and confused on how to select the best model for my 7 response variables. Should I use the AIC (via backward selection) to select the best fitted model or should I just use 3 models (of which I selected the explanatory variables, one with only 2, one with 5 and one with 5 explanatory variables+interactions). Please help me what should I do on this. I've done too many researches but they have used different methods and just confused me more. Huhu
@@chloefouilloux one more things please. Is it okay to use just one model for my different 7 response variables?
@@rubyanneolbinado95 Hi hi! Okay, let me tackle these one at a time. (1) One glm model for 7 predictors is probably not going to be great (especially if there are interactions!). These models tend to be *overfit* which means that you are trying to split your data into too many little boxes-- fewer predictors means more explanatory power (check dharma part of the video-- you can check dispersion of your model using dharma too!). (2) So, how to reduce the number of predictors? Well, you can do the backward selection that you mention, for sure. I don't love to use this method *initially* because it can get rid of the variables you are actually interested in! (because stepwise isn't a biologist, you are!). I would first check if any of your predictors are collinear/autocorrelated! (ex. mass and length are two variables that often are highly correlated-- when you have too much autocorrelation between predictors, they get mad at each other and wreck your model) -- here, you can check correlation between variables *and choose which one is more biologically reasonable* to keep in the model-- drop the other ones. (3) If option 2 isn't working out for you, a GLM just might not be the right model for your data! I would start thinking about a PCA or more advanced modelling, like mixed models. Hope this helps :)
OMG, this is pure gold! Thank you so much <3
Can you do a video explaining what family of curve to choose? Here you have picked gaussian each time. I am struggling with this step in my own glmm's. Thanks for all your help so far, this was an interesting example!
This video is the first video of yours that I’ve come across and I just wanted to say, I absolutely love your teaching and presentation style!! Your enthusiasm and explanation style are so engaging, it’s awesome; and, the way you break things down whilst also simplifying concepts is great, especially because such concepts are generally taught/explained in a much more complex way in university courses, textbooks, and in other UA-cam/online tutorials - together, I feel this all really helps with improving understanding of all concepts discussed. I’m a postgrad student and would have loved to have access to this type of content in my earlier years when learning stats - I must say though, I’ve still learnt some new info from this tutorial!! Would love to see more R programming tutorials like this one - if you’re thinking about posting more, please do because you definitely have the gift of making stats engaging and fun (descriptive words that you don’t usually find when people are talking about stats 😅). Thanks for this content!! 🙌
Thanks so much for this video, I feel like I have some clarity in understanding GLMs and my outputs so much more now. It feels good to have this confidence!!!
Dear Chloe, thank you very much for take your time to give us this tutorial. I´m new in RStudio and I really enjoy seeing all the graphs and analysis posibilities it offers. New subscriber.
antarctic research student here! Super helpful and interesting video!!
Very informative video with a refreshing amount of humour (which is rare to find in the world of statistics). Never had so much fun watchin this kind of videos, congrats haha! I would love to see more videos on GLMMs cause its cool but also complicated af
This really helped me fill in some knowledge gaps I had about the GLM, thanks so much 😊
Super useful that mutation tho!
You are hot
No no no... I say to have at least 30 in each group.... If the data is sparse, it can cause problems...
I mean that is definitely better! But man oh man, try recapturing bank voles in the middle of an enormous forest over a summer. They are tiny little jerks!!!
The thumbnail tho!!!! LOL why did you have to make me feel old?! LOL!
I recognise that mixed effect model schematic on the thumbnail from Silk, Harrison & Hodgson 2020 PeerJ
Yes! Beautifully written by some great researchers ;) I linked the paper in my GitHub, but added it now to the video description as well!
Very specific but should you have expertise in setting up MaxEnt with SWD files to run several projections out of the same model...videos would be highly appreciated 🙃
Thanks!
I love how you present it :) thank you!
This was super useful and helpful - shows how to approach different questions/situations. I was wondering how you learned R and if there was any particular source that you found super useful? I'm a university student and I enjoy using R very much but unfortunately did not have many modules that explored it in a more advanced way.
chloe ily this is such a good video
We have such fancy frogs here in my place. I saw it only once, Gree, clean black eyes, long lengs and red feet.
Hi Chloe, I was curious about the plot at 03:57. Given that you've got one categorical predictor with three levels (i.e., species) in your model, I wanted to know what the x-axis of this plot was. Presumably, this axis is species, but then why are the values not in three vertical clusters like in your half-eye plot? I thought it might have been because, in the plot at 03:57, you jittered the values associated with each level of the predictor variable; however, the values are more spread out horizontally for that. So I downloaded the files from your github site so that I could see what code you used for the plot at 03:57. However, unless I'm mistaken, the code for the plot at 03:57 wasn't in the markdown file. Also, when I ran the markdown file, the code crashed at this line: testDispersion(mod2a). I assume that this is because mod2a was not defined earlier in the code.
Excellent content and presentation... thanks a lot for that!
I really enjoy the goofy nature of your videos, keep making them if you get the chance!
Your frustration with fitting quadratic functions on linear data got me 🤣
I am learning mixed effect linear models - could you do a video on how to interpret the outcome of those types of models? I have tons of info on the modeling aspect but not entirely sure how to leverage the output effectively. I appreciate the humor and thoughtfulness in your videos to make them interesting.
Very good explanation, helpful reminder. And appreciate the tip on the Dharma package.
This was really helpfull, clear, and fun to watch ! thank you very much :)
Thank you! Amazing explanation! Really helped me understand key aspects of a GLM. And thanks to the tip on the DHARMa package!
Loved your video! Have you ever used check_model() from the performance() package?
I haven't! I just looked it up and it looks pretty cool. It seems very similar to DHARMa but perhaps a bit more flexible, which can be good or bad depending on your handling on stats (for example, I see that you can compare models with different parameters from different datasets within the same call! that seems. . . dangerous. . .and can be super misleading if you don't know what is underlying the output).
For sure! I am slowly but surely making the transition to R by way of SPSS and then Stata, and am constantly amazed at how flexible R can be-for better or for worse! I have only tinkered with check_model(). I like that it offers a vehicle to visually inspect the most salient OLS assumptions at once, and especially love the added guidance of what you should be looking for to guide your interpretation. Merci mille fois !
Hi Chloe what’s your background (profession) ? Academics or …. ???
Hi! I am in academia, yes! Which is why the videos are quite irregular, but I am going to try to get one up before the holidays!
Great explanation! thank you so much for the video. Could you please make a video about which glm models can be used when the data is not normally distributed?
Super helpful, what model would use for data that is not normally distributed?
Thank you so much Chloe!