
- 25
- 219 974
Chris Kimmer
Приєднався 26 чер 2014
Відео


Alternative metrics for association rules in Weka
Переглядів 2 тис.10 років тому
Alternative metrics for association rules in Weka


covariance and correlation for association rules
Переглядів 46610 років тому
covariance and correlation for association rules


How to convert decision trees to rules
Переглядів 13 тис.10 років тому
How to convert decision trees to rules
Graphical Interpretation of decision trees
Переглядів 1 тис.10 років тому
Graphical Interpretation of decision trees
Crisp and clear. Thanks for explaining.
I didn't get how you considered t=4 for outlook
Video of useful but I doubt interpretation of variance explained by model. shouldn't we be looking at proportion and cumulative columns for variance explained rather than looking at ranked attributes figure?
Best video ever the best I say
Is this new moon app. Safe from third parties apps? Is it safe to leave my card no.? Also, I just wanted to try for one month first.
Vtu guys give a like 👍
anyone from scc 202?
Great explanation, Thank you
Hi, regarding feature extraction using PCA I applied PCA filter on input dataset that consists of 13 predictors and got 18 principal components. Is it possible? At first, the input dataset consists of 6 missing values with that it produced 12 PCs when replace the missing values with majority mark of that particular features I got 18 PCs. May I know what exactly the concept behind this? By the way I used Cleveland heart dataset and WEKA platform. Thank you.
My ranked attribute values aren't adding upto 100.. if anyone could explain what am I doing wrong?
6:25
Awesome. Thank you!
Poor audio
isn't, for example, distance 2 must be distance 2 - distance 1?
Thanks, my lecturer spent 15 minutes explaining this through a long winded example about a boy and a girl going to lunch and the correlation relating to whether the boy was in love with the girl and was purposely trying to see her at lunch. Thankyou for not wasting my time like my $2000 uni course.....
Great job!
Hi Chris great video can I ask a question please
Hi
one question, are these just some random questions that associated with the task or it's kinda standard...
Those are the standard questions.
thank you very much for explaining the concept with a very easy and understandable example!
Great explanation sir. but what after that ?? how to use this data in my model. I'm making a IDS model for detecting attacks and I need to reduce the features to get faster and accurate detection
комментарий
You are the best explainer in this topic i've found in UA-cam. The indian guys i've found are really amazing, but the bad english and the lack of focus are barriers to acknowledgement. Congratulations and thank you for have a script before recording the video and for being so patient during it.
Great video, clear to understand...
hey thanks a lot, the tutorial really helpful !!
Great content. Thank you so much for explaining it. But I think it's worth pointing out that the ranked values don't add up to 1. When you try with other datasets, these values are all less than 1, but certainly aren't adding up to 1. For example, I got 0.74, 0.52, 0.39 for the first 3 attributes (there were more) for the diabetes dataset. I would say that it was just a coincidence the values got in the video, but even in the cpu dataset that was used in the video, they don't add to 1 as well. They appear to, at a first look, but when you actually add them up, you get 1.0473. Close, but not 1. Thanks anyway, all the rest is really helpful.
Hey. Is there somewhere i can find this test? :)
Was there a reason play button was not replaced to stop button while recording?
This is such a great explanation. Thank you
Can you explain did you captured movement time in the data?
congnintgoivhfsdgb walktwefuiah
good comment
First of all thanks for the great video! It was very helpfull in understanding a Cognitive Walkthrough. But one Question :P Obv the camera symbol is too close to the stop button, but isn't that the reason why they actually use a circular symbol instead of the camera symbol for recording (since it's also closest to the common analog button)? And aswell don't u think an "X" will be missleading for canceling the action rather than just stoping the video?
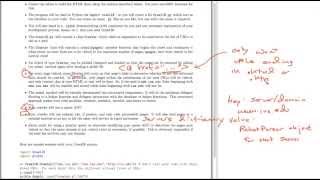
in rules building, you have two things cause and result. you can guess leaf is a result because it carries a decision. for example, your diabetes data starts split with the age attribute and after two splits using different attributes get a pure subset. Thus If Age >=30, Fat person, and No regular exercising, then Yes patient has diabetes.
What about when dummy variable appear as <=0.5? For example, I have a decision tree built in python. One of the nodes is EnglishEducation_Partial College<=0.5. EnglushEducation was a variable and Partial College was one of the values. Would I interpret that node as (Data[EnglishEducation] is not equal to Partial College)?
I think dummy path or decision is only to keep the transaction in tree. See to your dummy if only applied for keep a sequence in the tree, then ignore it and build your rules based on real variable which named in your dataset.
Thanks
Awesome job with this tutorial, very helpful thanks
not my proudest fap
same
Thank you for this excellent video. If you are working with R you can use the OneR package for that, it is on CRAN. Please watch this video for a step-by-step introduction: ua-cam.com/video/AGC0oRlXxgU/v-deo.html You can find out more about it here: cran.r-project.org/web/packages/OneR/vignettes/OneR.html
Thank you for this excellent video. If you are working with R you can use the OneR package for that, it is on CRAN. Please watch this video for a step-by-step introduction: ua-cam.com/video/AGC0oRlXxgU/v-deo.html You can find out more about it here: cran.r-project.org/web/packages/OneR/vignettes/OneR.html
nice, mate..superb explanation...
thanks for sharing, very good tutorial!
Hello, quick question. Should the data be normalized before I use PCA? Thanks for sharing.
what type of pen is that? I had one of them in highschool and it was my favorite pen of all time.
I think its a Ball pointer with less viscous Gel. In my area we just ask for a Gel Pen to get one of these.
Thanks, very intuitive...
Hello. Really practical video. I have one question: How do you define the threshold? I mean why 50% or 40%? Do these numbers come out of random? During the first phase, I realized that it is easy to select features since they are ranked ( so they use something like entropy algorithm or so). But what about these percentages that you are mentioning? Where do they come from? Thank you in advance!
Great . Amazing Job
I watched the whole video & I swear I still don't know what it is ! :/
It's the validation of an interface implying observing an user during it's usage.
Very well done. Great reference for students and those new to UX.
Very Simplified , Great stuff
Rainy should be 3/9
Thank you so much! its to ease to understand it ! keep it up #usabilty #engineering
For some reason my ranked attribute variance doesn't add up to. Does anyone know whats the isssue with it
Hozaifah Zafar I got the same problem
i think the one that add up to 1 is the proportion part of the PC, not the one he pointed out
Can I use PCA with dataset containing non-numeric attributes?
no