
- 10
- 154 082
AMC-Tec
Sri Lanka
Приєднався 28 тра 2020
Advanced Materials Characterization Techniques (AMC-Tec).
We are from the Advanced Materials Research Laboratory (AMReL), University of Peradeniya, Sri Lanka, which mainly engaged with research based on thin film solar cells, gas sensors and value addition to the natural graphite. In this channel, we demonstrate advanced thin film deposition techniques, characterization techniques and solar cell fabrication techniques.
Additionally, we discuss advanced analysis techniques using specific software.
Contact
Dr. Isuru Lakmal
isurul@sci.pdn.ac.lk
Close-spaced Sublimation (CSS) Process - Advanced Materials Research Laboratory (AMReL) - AMC-Tec
Close-spaced sublimation (CSS) is a technique for producing thin films of materials, especially semiconductors, by heating a solid source and a substrate in close proximity. The source material sublimes, or directly converts from solid to gas, and then condenses on the substrate, forming a thin film. This process can be done in vacuum or atmospheric pressure, and it is relatively fast and simple compared to other methods of physical vapor deposition.
One example of a CSS system is the MTI Corporation OTF-1200X close-spaced sublimation system, which can be used to deposit thin films of cadmium telluride (CdTe), a material widely used for solar cells. This system has a quartz tube chamber that can accommodate substrates up to 5 inches in diameter. The chamber is heated by halogen lamps, and the temperature can be controlled by a programmable controller. The system also has a gas inlet and outlet for introducing and evacuating different gases, such as nitrogen, argon, or oxygen. The system can operate in both vacuum and atmospheric pressure modes.
To use the RTP-II-5 system for CSS deposition of CdTe, the following steps are typically followed:
Prepare the source material and the substrate. The source material can be either CdTe powder or a CdTe wafer. The substrate can be glass, metal, or another semiconductor. The substrate should be coated with a thin layer of cadmium sulfide (CdS) as a buffer layer before the CSS deposition.
Load the source material and the substrate into the quartz tube chamber. The source material should be placed on a graphite plate at the bottom of the chamber, and the substrate should be placed on another graphite plate above the source material. The distance between the source and the substrate should be about 1 mm.
Set the desired temperature profile and gas flow rate on the controller. The temperature profile should include a ramp-up stage, a dwell stage, and a ramp-down stage. The ramp-up stage should heat the chamber to about 600°C in about 10 minutes. The dwell stage should maintain the temperature at 600°C for about 10 minutes. The ramp-down stage should cool down the chamber to room temperature in about 10 minutes. The gas flow rate should be set to about 100 sccm of nitrogen or argon during the whole process.
Start the CSS deposition process by turning on the halogen lamps and the gas flow. The source material will sublime and deposit on the substrate as a thin film of CdTe. The thickness of the film can be controlled by adjusting the temperature, time, and distance parameters.
After the CSS deposition is completed, turn off the halogen lamps and the gas flow. Wait until the chamber cools down to room temperature before opening it.
Remove the substrate with the CdTe film from the chamber. The film may need further processing, such as annealing, doping, or contacting, to improve its properties and performance.
To fabricate the CdS/CdTe solar cell using this system, you can follow this methodology:
Use 4N grade source materials of CdTe placed on a graphite crucible.
Use CdS thin films coated on FTO substrates as the substrate for the CdTe deposition.
Place the substrates on the crucibles so that the separation between the source to substrate is 4 mm.
Use 6% oxygen with argon as a carrier gas as the ambient and maintain the chamber pressure at 10-11 Torr.
Set the substrate and source temperatures at 610 and 680 °C, respectively.
Carry out the deposition for 140 seconds.
AMC-Tec
Переглядів: 267
Відео


Prototype Manufacturing of Solar Panels with Demonstrations
Переглядів 7732 роки тому
Prototype Manufacturing of Solar Panels with Demonstrations

XRD Operation Procedure - Part 2 - Rotational Powder Sample Stage Installation
Переглядів 5002 роки тому
Keypoints * Visual inspection of Rotational Powder Sample Stage. * Installation of the stage to the goniometric system. * Attaching of Nickel filter (Ni 0.02) to preferentially reduce the intensity of the Kβ line in the X-ray spectrum compared to Kα. * Identification of hardware configuration (X-Ray tube Twine Primary: Motorized slit Sample stage Twine Secondary: Motorized slit Ni filter 2.5 So...

Portable Solar Simulator PEC L01 | AMC-Tec
Переглядів 1,6 тис.3 роки тому
Portable Solar Simulator PEC-L01: Compact integrated solar simulators for Laboratory use. PEC-L01 is a handy type of solar simulator equipped with Air Mass 1.5G (AM1.5G solar irradiation spectrum) filter for measuring solar cells in laboratory research. Features ・ Lamp house, Power Supply, Unit Body ・ Controller: Touch panel controller ・ Illumination head 360o Rotatable ・ 5cm square Optical fil...

XRD Operation Procedure - Part 1 - XYZ Sample Stage Removal for Powder Sample Stage Installation
Переглядів 6103 роки тому
XRD Operation Procedure - Part 1 - Compact UMC stage (XYZ Sample Stage) Removal for Rotational Powder Sample Stage Installation. Highlighted features of Bruker D8 Advance Eco XRD machine 1 kW X-ray source High-brilliance, 1kW long lifetime X-ray source for highest efficiency. Reduces energy consumption and eliminates the need for external cooling water. SSD160 detector 1-dimensional detector fo...

Vacuum Thermal Evaporation Systems - Advanced Materials Research Laboratory (AMReL) - AMC-Tec
Переглядів 1,6 тис.3 роки тому
These are the Vacuum Thermal Evaporation systems available in the Advanced Material Research Laboratory (AMReL), University of Peradeniya, Sri Lanka. The first thermal evaporator is a manual operational one which mostly used for semiconductor thin film (CdS, CdTe, CdCl2, etc.) depositions. The second thermal evaporator (Edwards AUTO 306 Vacuum Coater) is a fully automated one that is usually us...

Advanced Materials Research Laboratory - University of Peradeniya - Sri Lanka
Переглядів 6123 роки тому
Few research facilities of Advanced Materials Research Laboratory (AMReL)
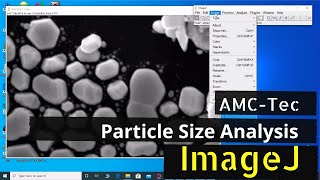
ImageJ - Scanning Electron Microscope (SEM) (Advanced) - Particle Size Analysis | AMC-Tec | #002
Переглядів 33 тис.4 роки тому
Scanning Electron Microscope (SEM) Image Analysis (Advanced) - Particle Size Analysis using the Threshold function of ImageJ software. AMC-Tec | Video #002 Key point * Setting up the scale * Use of Analyse particle function * Use of Threshold to distinguish particles * Use of FFT Bandpass filter * How to select optimum threshold value ImageJ software drive.google.com/file/d/1p4aweoils-CX85WbCNa...

Advanced Materials Characterization Techniques - (AMC - Tec)
Переглядів 9734 роки тому
Material preparation for CdS/CdTe solar cells. * Chemical Bath Deposition * Electro Deposition * Thermal Evaporation
ImageJ - Scanning Electron Microscope (SEM) Image Analysis (Basic) - Particle Size | AMC-Tec | #001
Переглядів 114 тис.4 роки тому
Scanning Electron Microscope (SEM) Image Analysis (Basic) - Particle Size Analysis using ImageJ software. AMC-Tec | Video #001 ImageJ software drive.google.com/file/d/1p4aweoils-CX85WbCNaMBEiXamRKPu54/view?usp=sharing SEM Examples drive.google.com/file/d/12suCuY61oVbJOtdEDoMOtXsHBgkUe37P/view?usp=sharing Advanced Materials Research Laboratory Department of Physics University of Peradeniya Sri L...
good work sir thank you for excellent explanation
Thank you very much for your kind feedback.
We have seen in many papers that the nanoparticles range is from e.g 15-30 nm plz tell that how to find range
Hello. Once you follow the instructions given in this video, you will get a number of measurements. Find the minimum and maximum values and you can express those values as a range (min-max nm).
If in the SEM picture the unit is a micrometer then selecting the scale which unit we have to put tmicrometer or nm? I need a measurement of nanoparticles in nm.
@@azmatullah4555 You have to use the same units. Otherwise, it will not fit the image scale.
Thank you so much Okay it means that if SEM image has 10 micrometer then I have to put unit micrometer in selecting scale @@amc-tec7721
@@azmatullah4555 Yes. That's correct.
What does mean, min and max data represent in the area and length measurement ?
The Min and Max values represent the grayscale value ranging from 0 to 243. This gives an insight into the Z-axis variation of the profile (minimum depth and maximum height). If a particular pixel is lighter, it means a higher Z-axis value.
Thanks for sharing, when I save image, scale bar disappear in saved picture !! I have save photo as BMP form
The problem solved, I have saved it in PNG form
@@aminadz7890 Happy to know that you fixed the issue. Also, check ua-cam.com/video/4xAKFYFABDI/v-deo.html You will find that "Overlay" is unchecked. This is important.
Thank u so much.
The presentation was aesthetically pleasing and the substance was of high quality. Thanks alot!!
Thank you very much for your feedback.
it is so good what type of soiftware is used
It's ImageJ. An opensource sofrware.
Eskelyiy koi app hai kya
Could you please ask the question in English?
how can I contact you
You can contact me via email (isurul@sci.pdn.ac.lk). Also, you can post your question here, and I'll reply to it.
Can you please help with videos of other parameters that could be determined from SEM image
I like to ask few questions like what....
Feel free to ask your questions.
Very educative. Thank you
Hello, great video! I was curious on the type of graphite crucible you're using for deposition?
Hello. Thank you for your comment. What specifically do you want to know about these graphite crucibles? Feel free to ask for any details.
@@amc-tec7721 Hi, mostly just looking for the dimensions of the crucible, or if it's not too much trouble could you provide a link from where I could obtain one? That would also be extremely helpful. Thanks!
@@Malzzel Hello, These are the crucibles that we ordered. www.aliexpress.com/item/1005001547841703.html?spm=a2g0o.order_list.order_list_main.36.42351802C9GWhN
@@amc-tec7721 Great, thank you so much! :)
thank you so much , please unit of particle size ?
Since we input "nm" as the unit, it will give all the dimensions in "nm".
@@amc-tec7721 ok thnak you 😇
I searched for hours finally found all in one. Thank you so much,
I'm really happy since this was helpful for you.
Can you say about, from where the CSS unit was purchased.
This is from the MTI group, USA. www.mtixtl.com/index.aspx
Thank you for the video. It is very educative. Please how can I use it for pore size and volume?. Thank you
Thank you for your comment. I think it's better to use BET analysis if you are using porous materials. Even though SEM can provide Z-Axis data using the greyscale, you can not accurately calibrate it. Without the Z-axis, you can't discuss volumes. You can measure pore diameters (and areas) using this method. If you want to get Z-axis details and obtain volume information, use Gwyddion, and you may get some values. I'm not sure about its accuracy.
Nice 👍
Mute the video, the audio is just ear cancer
Sorry for the trouble. I'll take this as an advise for future videos.
nice
Thank you so much for this video❤ Your explanation is too good to follow. It is very helpful for me...thank you!!
Thank you so much for your comment, and happy to hear it helps you.
Dear Master, could you please make a video regarding the XRD peak analysis, EDS spectra analysis? If it understanding means I'll feel comfortable in characterisation. Kindly accept my request. Thank you in an advance.
Sure. I'll make some videos regarding those characterization and related softwares. Thank you for the suggestion.
Wao Sir really superb. Bravo Dear Master, could you please make a video regarding the XRD peak analysis, EDS spectra analysis? If it understanding means I'll feel comfortable in characterisation. Kindly accept my request. Thank you in an advance.
Sure. I'll make some videos. Until that if you have any doubts about XRD and EDS analysis, don't hesitate to mail me. (aaisurulakmal@gmail.com).
After setting scale bar and and fig number in image, the scale disappearsin duplicate image every time. What to do?
Please check comments below. I have given an answer for this question earlier to another user. Feel free to reply if that doesn't helps you.
Nicely
I have a question please guide me
Sure. What is it?
thanx it is really healpful
Thank you...
Very informative session sir
Thank you...
The customized scale we put in the SEM image do not appear in the image when the image is inserted in our presentation. Please help
After adding custom scale and other texts, try saving it in different file formats (JPG, PNG,...).
9:25, you can see the overlay is unchecked. This is important.
Thank you
plz make a video for pore size determination u explained really well thanks
I need zview, please help me
how to set the scale if there is no scale given in the image? when I captured the picture from a stereo microscope, there was no mention of the scale in the image, it would only show if I take a screenshot from the computer. What should I do now to set scale? the scale mentioned in the computer was 0.0787MM
For any measurements using ImageJ, you need a known scale or known length. Without that you can't measure any. In your case, if it's possible to get known distance by taking screenshot, you can go for that and do the measurement. For your publications, you can use the original one. I hope I got your question correctly.
Love it. Good video 😊
Thanku somuch
Beautiful Explanation Thanlkyou SO much
Really appreciate your feedback.
Great video. thanks
Thank you for the video. But I want to ask, once the scale bar had been customized, how do we measure our sample? Is it same like the first step?
Even though we have placed a new scale, dimension vice, it's the same. So it will not affect the measurements. You can do the same measurement using the customized scale anytime, as done in the first step.
@@amc-tec7721 Does as done in the first step mean we measure the customized scale bar first. Then, proceed to enter the known distance in the set scale with the value from the scale bar. After that, do measurement for the sample. Am i understand it correctly?
@@nurmaaeina2083 Yes. You are correct.
@@amc-tec7721 Alright, thank you Sir.
Thank you for this nice video. how to measure, if there is no scale bar provided with the picture?
You must need to have any known distance in the image. As an example, if your sem image contains a micro-scale circuit and if you know the distance between two current paths, you can take that as a scale bar. If the image is the original one from the SEM machine (.TIF file format), you can use Gwyddion software without having a scale bar.
why did you put 500nm at the picture when the bottom bar written 100nm?
The important thing is visibility. You may add several SEM images together in your manuscripts. In this case, you have to reduce the size of the images so they may not visible clearly. In this case, it's better to extend the scale a bit. This is a good practice for manuscript writing.
@@amc-tec7721 which means, the 500nm label is an example not the true size of the SEM image printed?
@@nurulnawwaraliaabintimahmo778 It is a true scale. Look carefully at what happened to the scale when I change the value to 500 nm. It relatively increases. I hope you understand the basic fundamentals of a scale. It's a relative one. Even though you change the scale to any value you like, the measurements taken using that scale must be the same. You can try different scales and measure a specific particle or grain or any object in the images. It should give you the same measurement. Feel free to ask if you have any doubt.
@@nurulnawwaraliaabintimahmo778 Also, it is not compulsory to put the exact scale printed in the original SEM image.
What application did you use
ImageJ
Is there any application that you use to view the sem image
To view, you can use any image viewer including windows image viewer. For the analysis purpose, I used ImageJ software.
Earlier scale was 100 nm but u used 500 nm. Can we change the scale?
Of course, you can change the scale to any clearly visible value. Any journal accepts that.
Thanks 🙏
sir can u please help me I need this software
Please use this link to download the software. imagej.nih.gov/ij/download.html
What is binning?
Consider you have a distribution of data and you need to plot a histogram. Simply, partitioning the data in the distribution to the number of groups in an ascending or descending order can be named as binning and one of that groups is a bin.
finally, i found this
I'm really happy if this helpful for you.
Sir will you help me for some image processing, related to trichome (hair like structure on leaf) counting ? I am trying but not getting proper results.
Sure. What do you have to measure? If you want, contact me through the mail. (aaisurulakmal@gmail.com)
Dear Mahesh, It's my pleasure to help with this regard. If you need to calculate trichome density, you have to select a known area and count the number of trichomes. In this case, it's better to select your lower magnification images so you can count higher numbers. It will reduce the standard deviation. For that, first, you have to set the scale as I described in the video. In the top left of the image, you can find the dimensions of the image. So you can find the area of the image. Once you count the number of trichomes, by dividing it by area, you can find the density of trichomes. If it is too difficult to count in a large area, you can crop the image and get a smaller area. Since the trichomes are not linear, you can't measure the length with the straight line tool. In your case, you have to use segmented line tool. You can access it by right clicking on the straight line tool. In my video I have used two points to draw a straight line and in your case, you have to put several points to measure curved objects. When you put this points on Image, you can put the last point by right clicking. Finally you can measure the lengths as described in the video. Good luck.
@@amc-tec7721 Thank you sir
Thank u sir
How to measure the velocity of a rising bubble in any solution using Image J?
ImageJ can be used to analyse images. So you have to get two images in a known time frame. In both two images, mark a reference point below the bubble (consider a fixpoint of the images such as a scratch of the solution container). Measure the distance between the bubble and the reference in two images and subtract them so you know the distance it travelled. Since you know the time it took, you can find the velocity.